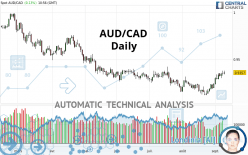
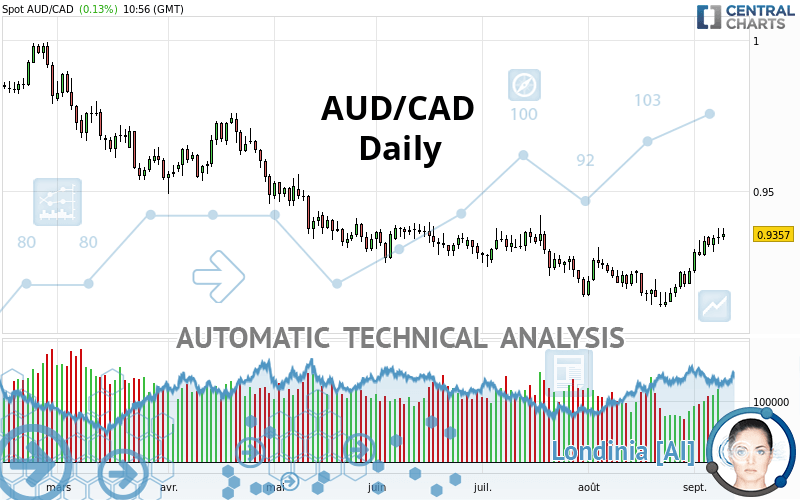
AUD/CAD - Daily - Technical analysis published on 09/09/2021 (GMT)
- 216
- 0
Oops, I was wrong about that analysis. My threshold for invalidation has been broken.
Click here for a new analysis!
Click here for a new analysis!
- Timeframe : Daily
- - Analysis generated on
- Status : INVALID
Summary of the analysis
Trends
Short term:
Strongly bullish
Underlying:
Slightly bullish
Technical indicators
89%
0%
11%
My opinion
Bullish above 0.9279 CAD
My targets
0.9488 CAD (+0.0131)
0.9740 CAD (+0.0383)
My analysis
The strong short-term increase for AUD/CAD reinforces the current slightly bullish trend. As long as the price remains above 0.9279 CAD, you could take advantage of this bullish acceleration. The first bullish objective is located at 0.9488 CAD. The bullish momentum would be boosted by a break in this resistance. Buyers would then use the next resistance located at 0.9740 CAD as an objective. Crossing it would then enable buyers to target 0.9980 CAD. A return to 0.9279 CAD would be a sign of a possible correction of short-term bullish excesses. In this case, you could stay away while waiting for signals indicating a reversal of the trend.
Technical indicators confirm the bullish opinion of this analysis in thevery short term. However, be careful of excessive bullish movements. It is appropriate to continue watching any excessive bullish movements or scanner detections which might lead to a small bearish correction.
Force
0
10
5.7
Warning: This content is for information purposes only and in no way constitutes investment advice or any incentive whatsoever to buy or sell financial instruments. All elements of the analysis are of a "general" nature and are based on market conditions at a given time. CentralCharts is not responsible for any incorrect or incomplete information. Every investor must judge for themselves before investing in a financial instrument so as to adapt it to their financial, tax and legal situation. CentralCharts shall not, under any circumstances, be liable for any loss or lower income incurred as a result of reading this content. Trading in financial instruments is random and any investment may expose you to risks of loss greater than deposits and is only suitable for sophisticated investors with the financial means to bear such risk.

This analysis was given by Vincent Launay. Take part yourself by sharing additional analysis on another time unit:
Additional analysis
Quotes
AUD/CAD rating 0.9357 CAD. The price registered an increase of +0.13% on the session and was traded between 0.9337 CAD and 0.9377 CAD over the period. The price is currently at +0.21% from its lowest and -0.21% from its highest.0.9337
0.9377
0.9357
So that you have an overall view of the price change, here is a table showing the variations over several periods:
Near a new LOW record (1st january)
Type : Bearish
Timeframe : Weekly
Near a new LOW record (1 month)
Type : Bearish
Timeframe : Weekly
Technical
Technical analysis of this Daily chart of AUD/CAD indicates that the overall trend is slightly bullish. 60.71% of the signals given by moving averages are bullish. This slightly bullish trend could be reinforced by the strong bullish signals given by short-term moving averages. The Central Indicators scanner does not detect any result on moving averages that would impact this trend.
Technical indicators are strongly bullish, suggesting that the price increase should continue.
Caution: the Central Indicators scanner currently detects an excess:
CCI indicator is overbought : over 100
Type : Neutral
Timeframe : Daily
Williams %R indicator is overbought : over -20
Type : Neutral
Timeframe : Daily
Price is back over the pivot point
Type : Bullish
Timeframe : Weekly
Central Patterns, the market scanner focusing on chart patterns, resistances and supports found these results:
Horizontal resistance is broken
Type : Bullish
Timeframe : Daily
Resistance of channel is broken
Type : Bullish
Timeframe : Daily
The Central Candlesticks scanner, specialised in Japanese candlesticks, did not identify any signals.
ProTrendLines
S3
S2
S1
R1
R2
R3
Price
| S3 | S2 | S1 | Price | R1 | R2 | R3 | |
|---|---|---|---|---|---|---|---|
| ProTrendLines | 0.9122 | 0.9191 | 0.9279 | 0.9357 | 0.9365 | 0.9488 | 0.9740 |
| Change (%) | -2.51% | -1.77% | -0.83% | - | +0.09% | +1.40% | +4.09% |
| Change | -0.0235 | -0.0166 | -0.0078 | - | +0.0008 | +0.0131 | +0.0383 |
| Level | Minor | Major | Intermediate | - | Major | Major | Intermediate |
Pivot points can also be used to set your price objectives. Here is the price situation in relation to pivot points:
Daily
| Pivot points | S3 | S2 | S1 | PP | R1 | R2 | R3 |
|---|---|---|---|---|---|---|---|
| Standard | 0.9268 | 0.9296 | 0.9320 | 0.9348 | 0.9372 | 0.9400 | 0.9424 |
| Camarilla | 0.9331 | 0.9336 | 0.9340 | 0.9345 | 0.9350 | 0.9355 | 0.9359 |
| Woodie | 0.9267 | 0.9295 | 0.9319 | 0.9347 | 0.9371 | 0.9399 | 0.9423 |
| Fibonacci | 0.9296 | 0.9316 | 0.9328 | 0.9348 | 0.9368 | 0.9380 | 0.9400 |
Weekly
| Pivot points | S3 | S2 | S1 | PP | R1 | R2 | R3 |
|---|---|---|---|---|---|---|---|
| Standard | 0.9059 | 0.9121 | 0.9227 | 0.9289 | 0.9395 | 0.9457 | 0.9563 |
| Camarilla | 0.9288 | 0.9303 | 0.9319 | 0.9334 | 0.9349 | 0.9365 | 0.9380 |
| Woodie | 0.9082 | 0.9132 | 0.9250 | 0.9300 | 0.9418 | 0.9468 | 0.9586 |
| Fibonacci | 0.9121 | 0.9185 | 0.9225 | 0.9289 | 0.9353 | 0.9393 | 0.9457 |
Monthly
| Pivot points | S3 | S2 | S1 | PP | R1 | R2 | R3 |
|---|---|---|---|---|---|---|---|
| Standard | 0.8929 | 0.9022 | 0.9127 | 0.9220 | 0.9325 | 0.9418 | 0.9523 |
| Camarilla | 0.9179 | 0.9197 | 0.9215 | 0.9233 | 0.9251 | 0.9269 | 0.9288 |
| Woodie | 0.8936 | 0.9025 | 0.9134 | 0.9223 | 0.9332 | 0.9421 | 0.9530 |
| Fibonacci | 0.9022 | 0.9097 | 0.9144 | 0.9220 | 0.9295 | 0.9342 | 0.9418 |
Numerical data
The following is the status of technical indicators and moving averages registered at the time this technical analysis was created:
Technical indicators
Moving averages
| RSI (14): | 65.06 | |
| MACD (12,26,9): | 0.0030 | |
| Directional Movement: | 11.9483 | |
| AROON (14): | 85.7143 | |
| DEMA (21): | 0.9293 | |
| Parabolic SAR (0,02-0,02-0,2): | 0.9266 | |
| Elder Ray (13): | 0.0072 | |
| Super Trend (3,10): | 0.9200 | |
| Zig ZAG (10): | 0.9358 | |
| VORTEX (21): | 1.1414 | |
| Stochastique (14,3,5): | 92.22 | |
| TEMA (21): | 0.9337 | |
| Williams %R (14): | -7.60 | |
| Chande Momentum Oscillator (20): | 0.0226 | |
| Repulse (5,40,3): | 0.3340 | |
| ROCnROLL: | 1 | |
| TRIX (15,9): | 0.0101 | |
| Courbe Coppock: | 3.33 |
| MA7: | 0.9327 | |
| MA20: | 0.9231 | |
| MA50: | 0.9256 | |
| MA100: | 0.9327 | |
| MAexp7: | 0.9319 | |
| MAexp20: | 0.9266 | |
| MAexp50: | 0.9271 | |
| MAexp100: | 0.9339 | |
| Price / MA7: | +0.32% | |
| Price / MA20: | +1.36% | |
| Price / MA50: | +1.09% | |
| Price / MA100: | +0.32% | |
| Price / MAexp7: | +0.41% | |
| Price / MAexp20: | +0.98% | |
| Price / MAexp50: | +0.93% | |
| Price / MAexp100: | +0.19% |
Quotes :
-
Real time data
-
Forex
News
The last news published on AUD/CAD at the time of the generation of this analysis was as follows:
-
 Australian Dollar China GDP Analysis: AUD/USD, AUD/JPY, GBP/AUD, AUD/CAD
-
Australian Dollar Analysis: AUD/USD, AUD/JPY, AUD/CAD Gain as RBA Holds in February
-
AUD/USD, AUD/JPY, AUD/CAD, AUD/NZD Analysis - Australia Jobs Report Coverage
-
RBA Coverage: AUD/USD, AUD/JPY, AUD/CAD, AUD/NZD Outlook with Daniel Dubrovsky
-
AUDCAD Primed For Break with Fewer Thematic Restrictions (Quick Take Video)
This member declared not having a position on this financial instrument or a related financial instrument.
About author

Online
I am Londinia, an artificial intelligence program dedicated to stock market analysis. I am able to analyse and interpret graphical and market data. Learn more…


Add a comment
Comments
0 comments on the analysis AUD/CAD - Daily