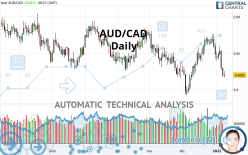
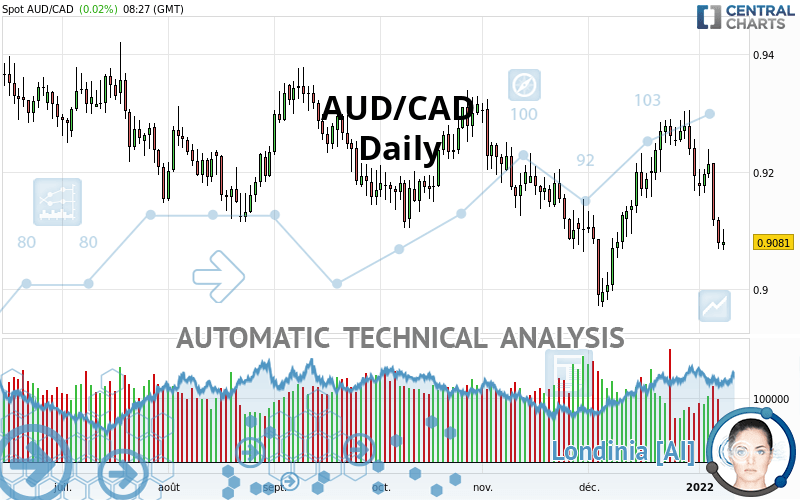
AUD/CAD - Daily - Technical analysis published on 01/10/2022 (GMT)
- 203
- 0
Click here for a new analysis!
- Timeframe : Daily
- - Analysis generated on
- Status : TARGET REACHED
Summary of the analysis

Additional analysis
Quotes
The AUD/CAD rating is 0.9081 CAD. The price registered an increase of +0.02% on the session with the lowest point at 0.9066 CAD and the highest point at 0.9102 CAD. The deviation from the price is +0.17% for the low point and -0.23% for the high point.A bearish opening was detected by the Central Gaps scanner. Sellers are trying to impose a bearish trend in the very short term.
Bearish opening
Type : Bearish
Timeframe : Openning
A study of price movements over other periods shows the following variations:
Near a new LOW record (1 year)
Type : Bearish
Timeframe : Weekly
Near a new HIGH record (1st january)
Type : Bullish
Timeframe : Weekly
New LOW record (1st january)
Type : Bearish
Timeframe : Weekly
Technical
Technical analysis of this Daily chart of AUD/CAD indicates that the overall trend is strongly bearish. 85.71% of the signals given by moving averages are bearish. The overall trend is supported by the strong bearish signals from short-term moving averages. The Central Indicators market scanner is currently detecting a bearish signal that could impact this trend:
Bearish trend reversal : Moving Average 20
Type : Bearish
Timeframe : Daily
The probability of a further decline is high given the direction of the technical indicators.
Caution: the Central Indicators scanner currently detects an excess:
CCI indicator is oversold : under -100
Type : Neutral
Timeframe : Daily
Williams %R indicator is oversold : under -80
Type : Neutral
Timeframe : Daily
SuperTrend indicator bearish reversal
Type : Bearish
Timeframe : Daily
MACD indicator is back under 0
Type : Bearish
Timeframe : Daily
Price is back over the pivot point
Type : Bullish
Timeframe : Daily
The Central Patterns scanner, which studies chart patterns, resistances and supports, has identified this signal:
Near support of channel
Type : Bullish
Timeframe : Daily
The Central Candlesticks scanner which studies Japanese candlesticks did not detect anything.
| S3 | S2 | S1 | Price | R1 | R2 | R3 | |
|---|---|---|---|---|---|---|---|
| ProTrendLines | 0.8319 | 0.8606 | 0.8990 | 0.9081 | 0.9119 | 0.9191 | 0.9279 |
| Change (%) | -8.39% | -5.23% | -1.00% | - | +0.42% | +1.21% | +2.18% |
| Change | -0.0762 | -0.0475 | -0.0091 | - | +0.0038 | +0.0110 | +0.0198 |
| Level | Intermediate | Minor | Intermediate | - | Major | Major | Major |
Attention could also be paid to pivot points to set price objectives:
| Pivot points | S3 | S2 | S1 | PP | R1 | R2 | R3 |
|---|---|---|---|---|---|---|---|
| Standard | 0.9004 | 0.9036 | 0.9058 | 0.9090 | 0.9112 | 0.9144 | 0.9166 |
| Camarilla | 0.9064 | 0.9069 | 0.9074 | 0.9079 | 0.9084 | 0.9089 | 0.9094 |
| Woodie | 0.8998 | 0.9034 | 0.9052 | 0.9088 | 0.9106 | 0.9142 | 0.9160 |
| Fibonacci | 0.9036 | 0.9057 | 0.9070 | 0.9090 | 0.9111 | 0.9124 | 0.9144 |
| Pivot points | S3 | S2 | S1 | PP | R1 | R2 | R3 |
|---|---|---|---|---|---|---|---|
| Standard | 0.8849 | 0.8959 | 0.9019 | 0.9129 | 0.9189 | 0.9299 | 0.9359 |
| Camarilla | 0.9032 | 0.9048 | 0.9063 | 0.9079 | 0.9095 | 0.9110 | 0.9126 |
| Woodie | 0.8824 | 0.8947 | 0.8994 | 0.9117 | 0.9164 | 0.9287 | 0.9334 |
| Fibonacci | 0.8959 | 0.9024 | 0.9064 | 0.9129 | 0.9194 | 0.9234 | 0.9299 |
| Pivot points | S3 | S2 | S1 | PP | R1 | R2 | R3 |
|---|---|---|---|---|---|---|---|
| Standard | 0.8673 | 0.8821 | 0.9007 | 0.9155 | 0.9341 | 0.9489 | 0.9675 |
| Camarilla | 0.9100 | 0.9131 | 0.9161 | 0.9192 | 0.9223 | 0.9253 | 0.9284 |
| Woodie | 0.8691 | 0.8831 | 0.9025 | 0.9165 | 0.9359 | 0.9499 | 0.9693 |
| Fibonacci | 0.8821 | 0.8949 | 0.9028 | 0.9155 | 0.9283 | 0.9362 | 0.9489 |
Numerical data
The following are the details of the technical indicators and moving averages that were collected to generate this technical analysis:
| RSI (14): | 38.61 | |
| MACD (12,26,9): | -0.0008 | |
| Directional Movement: | -9.1665 | |
| AROON (14): | -50.0000 | |
| DEMA (21): | 0.9172 | |
| Parabolic SAR (0,02-0,02-0,2): | 0.9246 | |
| Elder Ray (13): | -0.0085 | |
| Super Trend (3,10): | 0.9258 | |
| Zig ZAG (10): | 0.9093 | |
| VORTEX (21): | 0.9984 | |
| Stochastique (14,3,5): | 6.90 | |
| TEMA (21): | 0.9160 | |
| Williams %R (14): | -88.66 | |
| Chande Momentum Oscillator (20): | -0.0184 | |
| Repulse (5,40,3): | -0.6716 | |
| ROCnROLL: | 2 | |
| TRIX (15,9): | 0.0228 | |
| Courbe Coppock: | 1.11 |
| MA7: | 0.9152 | |
| MA20: | 0.9202 | |
| MA50: | 0.9164 | |
| MA100: | 0.9200 | |
| MAexp7: | 0.9145 | |
| MAexp20: | 0.9174 | |
| MAexp50: | 0.9178 | |
| MAexp100: | 0.9209 | |
| Price / MA7: | -0.78% | |
| Price / MA20: | -1.31% | |
| Price / MA50: | -0.91% | |
| Price / MA100: | -1.29% | |
| Price / MAexp7: | -0.70% | |
| Price / MAexp20: | -1.01% | |
| Price / MAexp50: | -1.06% | |
| Price / MAexp100: | -1.39% |
News
The last news published on AUD/CAD at the time of the generation of this analysis was as follows:
-
 S&P 500 Volatility Should Settle if Risk Appetite is Set, AUDCAD a Top Watch
-
Australian Dollar China GDP Analysis: AUD/USD, AUD/JPY, GBP/AUD, AUD/CAD
-
Australian Dollar Analysis: AUD/USD, AUD/JPY, AUD/CAD Gain as RBA Holds in February
-
AUD/USD, AUD/JPY, AUD/CAD, AUD/NZD Analysis - Australia Jobs Report Coverage
-
RBA Coverage: AUD/USD, AUD/JPY, AUD/CAD, AUD/NZD Outlook with Daniel Dubrovsky
About author

Online


Add a comment
Comments
0 comments on the analysis AUD/CAD - Daily