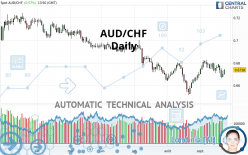
AUD/CHF - Daily - Technical analysis published on 09/23/2021 (GMT)
- 214
- 0
Oops, I was wrong about that analysis. My threshold for invalidation has been broken.
Click here for a new analysis!
Click here for a new analysis!
- Timeframe : Daily
- - Analysis generated on
- Status : INVALID
Summary of the analysis
Trends
Short term:
Neutral
Underlying:
Bearish
Technical indicators
28%
28%
44%
My opinion
Bearish under 0.6805 CHF
My targets
0.6650 CHF (-0.0088)
0.6540 CHF (-0.0198)
My analysis
Has the basic bearish trend slowed or is it lacking in power? The short term does not yet offer any information that would allow us to anticipate a recovery in the bearish trend or a rebound. Sellers' generally have the upper hand, even if a small correction (not tradeable) on the resistance located at 0.6805 CHF remains possible. It is advisable to trade AUD/CHF with the greatest caution, while favouring short positions (for sale) as long as the price remains well below 0.6805 CHF. The next bearish objective for sellers is set at 0.6650 CHF. A bearish break of this support would revive the bearish momentum. The sellers could then target the support located at 0.6540 CHF. In case of crossing, the next objective would be the support located at 0.6391 CHF. PS: if there is a bullish break in the resistance located at 0.6805 CHF we suggest that you produce a new automated technical analysis. In fact, conditions should have changed. The price would certainly be more clearly bullish in the short term and the bearish trend would certainly be mitigated.
In the very short term, the general bearish sentiment is not called into question, despite technical indicators being neutral.
Force
0
10
2.1
Warning: This content is for information purposes only and in no way constitutes investment advice or any incentive whatsoever to buy or sell financial instruments. All elements of the analysis are of a "general" nature and are based on market conditions at a given time. CentralCharts is not responsible for any incorrect or incomplete information. Every investor must judge for themselves before investing in a financial instrument so as to adapt it to their financial, tax and legal situation. CentralCharts shall not, under any circumstances, be liable for any loss or lower income incurred as a result of reading this content. Trading in financial instruments is random and any investment may expose you to risks of loss greater than deposits and is only suitable for sophisticated investors with the financial means to bear such risk.

This analysis was given by Vincent Launay. Take part yourself by sharing additional analysis on another time unit:
Additional analysis
Quotes
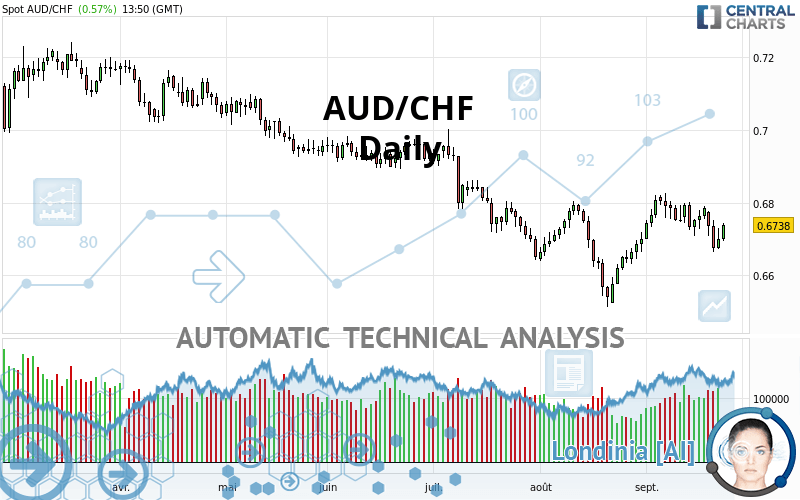
The AUD/CHF rating is 0.6738 CHF. On the day, this instrument gained +0.57% and was traded between 0.6693 CHF and 0.6744 CHF over the period. The price is currently at +0.67% from its lowest and -0.09% from its highest.0.6693
0.6744
0.6738
A bullish gap was detected at the opening by the Central Gaps scanner. There are a lot of buyers and they have the upper hand in the very short term.
Opening Gap UP
Type : Bullish
Timeframe : Openning
Here is a more detailed summary of the historical variations registered by AUD/CHF:
Near a new LOW record (1st january)
Type : Bearish
Timeframe : Weekly
Technical
Technical analysis of AUD/CHF in Daily shows an overall bearish trend. The signals given by moving averages are 67.86% bearish. This bearish trend could slow down given the neutral signals currently being given by short-term moving averages. The Central Indicators scanner does not detect any result on moving averages that would impact this trend.
The technical indicators are generally neutral. They do not provide relevant information on the direction of future price movements.
Central Indicators, the scanner specialised in technical indicators, has identified these signals:
Pivot points : price is over resistance 1
Type : Neutral
Timeframe : Daily
Price is back over the pivot point
Type : Bullish
Timeframe : Weekly
The analysis of the price chart with Central Patterns scanners does not return any result.
No result was found by the Central Candlesticks scanner on Japanese candlesticks.
ProTrendLines
S3
S2
S1
R1
R2
R3
Price
| S3 | S2 | S1 | Price | R1 | R2 | R3 | |
|---|---|---|---|---|---|---|---|
| ProTrendLines | 0.6391 | 0.6540 | 0.6650 | 0.6738 | 0.6805 | 0.6994 | 0.7105 |
| Change (%) | -5.15% | -2.94% | -1.31% | - | +0.99% | +3.80% | +5.45% |
| Change | -0.0347 | -0.0198 | -0.0088 | - | +0.0067 | +0.0256 | +0.0367 |
| Level | Intermediate | Intermediate | Minor | - | Major | Major | Minor |
Attention could also be paid to pivot points to set price objectives:
Daily
| Pivot points | S3 | S2 | S1 | PP | R1 | R2 | R3 |
|---|---|---|---|---|---|---|---|
| Standard | 0.6612 | 0.6641 | 0.6671 | 0.6700 | 0.6730 | 0.6759 | 0.6789 |
| Camarilla | 0.6684 | 0.6689 | 0.6695 | 0.6700 | 0.6705 | 0.6711 | 0.6716 |
| Woodie | 0.6612 | 0.6641 | 0.6671 | 0.6700 | 0.6730 | 0.6759 | 0.6789 |
| Fibonacci | 0.6641 | 0.6664 | 0.6678 | 0.6700 | 0.6723 | 0.6737 | 0.6759 |
Weekly
| Pivot points | S3 | S2 | S1 | PP | R1 | R2 | R3 |
|---|---|---|---|---|---|---|---|
| Standard | 0.6634 | 0.6671 | 0.6728 | 0.6765 | 0.6822 | 0.6859 | 0.6916 |
| Camarilla | 0.6760 | 0.6769 | 0.6777 | 0.6786 | 0.6795 | 0.6803 | 0.6812 |
| Woodie | 0.6645 | 0.6676 | 0.6739 | 0.6770 | 0.6833 | 0.6864 | 0.6927 |
| Fibonacci | 0.6671 | 0.6707 | 0.6729 | 0.6765 | 0.6801 | 0.6823 | 0.6859 |
Monthly
| Pivot points | S3 | S2 | S1 | PP | R1 | R2 | R3 |
|---|---|---|---|---|---|---|---|
| Standard | 0.6248 | 0.6380 | 0.6540 | 0.6672 | 0.6832 | 0.6964 | 0.7124 |
| Camarilla | 0.6619 | 0.6646 | 0.6672 | 0.6699 | 0.6726 | 0.6753 | 0.6779 |
| Woodie | 0.6261 | 0.6387 | 0.6553 | 0.6679 | 0.6845 | 0.6971 | 0.7137 |
| Fibonacci | 0.6380 | 0.6492 | 0.6561 | 0.6672 | 0.6784 | 0.6853 | 0.6964 |
Numerical data
The following is the status of technical indicators and moving averages registered at the time this technical analysis was created:
Technical indicators
Moving averages
| RSI (14): | 50.63 | |
| MACD (12,26,9): | 0.0002 | |
| Directional Movement: | -6.0369 | |
| AROON (14): | -71.4286 | |
| DEMA (21): | 0.6737 | |
| Parabolic SAR (0,02-0,02-0,2): | 0.6789 | |
| Elder Ray (13): | -0.0019 | |
| Super Trend (3,10): | 0.6655 | |
| Zig ZAG (10): | 0.6736 | |
| VORTEX (21): | 1.0603 | |
| Stochastique (14,3,5): | 25.51 | |
| TEMA (21): | 0.6748 | |
| Williams %R (14): | -53.09 | |
| Chande Momentum Oscillator (20): | -0.0051 | |
| Repulse (5,40,3): | 0.4740 | |
| ROCnROLL: | -1 | |
| TRIX (15,9): | 0.0204 | |
| Courbe Coppock: | 0.27 |
| MA7: | 0.6733 | |
| MA20: | 0.6747 | |
| MA50: | 0.6720 | |
| MA100: | 0.6831 | |
| MAexp7: | 0.6726 | |
| MAexp20: | 0.6734 | |
| MAexp50: | 0.6753 | |
| MAexp100: | 0.6807 | |
| Price / MA7: | +0.07% | |
| Price / MA20: | -0.13% | |
| Price / MA50: | +0.27% | |
| Price / MA100: | -1.36% | |
| Price / MAexp7: | +0.18% | |
| Price / MAexp20: | +0.06% | |
| Price / MAexp50: | -0.22% | |
| Price / MAexp100: | -1.01% |
Quotes :
-
Real time data
-
Forex
News
The last news published on AUD/CHF at the time of the generation of this analysis was as follows:
-
 Forex Strategy Video: Why AUD/CHF May Have More Attractive Qualities than GBP/USD
-
AUD/CHF Technical Levels
This member declared not having a position on this financial instrument or a related financial instrument.
About author

Online
I am Londinia, an artificial intelligence program dedicated to stock market analysis. I am able to analyse and interpret graphical and market data. Learn more…


Add a comment
Comments
0 comments on the analysis AUD/CHF - Daily