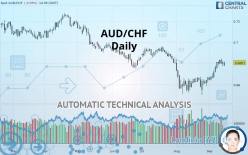
AUD/CHF - Daily - Technical analysis published on 09/16/2019 (GMT)
- Who voted?
- 126
- 0
Click here for a new analysis!
- Timeframe : Daily
- - Analysis generated on
- Status : INVALID

Summary of the analysis

Additional analysis
Quotes
The AUD/CHF rating is 0.6806 CHF. The price is lower by -0.10% since the last closing and was between 0.6775 CHF and 0.6819 CHF. This implies that the price is at +0.46% from its lowest and at -0.19% from its highest.The Central Gaps scanner detects a bearish gap which is a sign that the sellers have taken the lead in the very short term.
Opening Gap DOWN
Type : Bearish
Timeframe : Openning
Here is a more detailed summary of the historical variations registered by AUD/CHF:
Near a new LOW record (1st january)
Type : Bearish
Timeframe : Weekly
Near a new HIGH record (1 month)
Type : Bullish
Timeframe : Weekly
Technical
A technical analysis in Daily of this AUD/CHF chart shows a slightly bearish trend. Only 57.14% of the signals given by moving averages are bearish. This slightly bearish trend could quickly be reversed due to the strong bullish signals currently being given by short-term moving averages. The Central Indicators scanner detects bullish signals on moving averages that could impact this trend:
Moving Average bullish crossovers : AMA20 & AMA50
Type : Bullish
Timeframe : Daily
Bullish price crossover with Moving Average 100
Type : Bullish
Timeframe : Daily
In fact, according to the parameters integrated into the Central Analyzer system, 11 technical indicators out of 18 analysed are currently bullish. Caution: the Central Indicators scanner currently detects an excess:
RSI indicator is overbought : over 70
Type : Neutral
Timeframe : Daily
CCI indicator is overbought : over 100
Type : Neutral
Timeframe : Daily
Williams %R indicator is overbought : over -20
Type : Neutral
Timeframe : Daily
Pivot points : price is under support 3
Type : Neutral
Timeframe : Daily
Pivot points : price is under support 3
Type : Neutral
Timeframe : Weekly
Price is back over the pivot point
Type : Bullish
Timeframe : Daily
Price is back over the pivot point
Type : Bullish
Timeframe : Weekly
Central Patterns, the market scanner focusing on chart patterns, resistances and supports found these results:
Near horizontal resistance
Type : Bearish
Timeframe : Daily
Near resistance of triangle
Type : Bearish
Timeframe : Daily
Resistance of channel is broken
Type : Bullish
Timeframe : Daily
Central Candlesticks, the scanner specialised in Japanese candlesticks, detects a bullish signal that could support the hypothesis of a small rebound in the very short term:
Upside gap
Type : Bullish
Timeframe : Daily
| S3 | S2 | S1 | Price | R1 | R2 | R3 | |
|---|---|---|---|---|---|---|---|
| ProTrendLines | 0.6583 | 0.6668 | 0.6762 | 0.6806 | 0.6842 | 0.6994 | 0.7277 |
| Change (%) | -3.28% | -2.03% | -0.65% | - | +0.53% | +2.76% | +6.92% |
| Change | -0.0223 | -0.0138 | -0.0044 | - | +0.0036 | +0.0188 | +0.0471 |
| Level | Intermediate | Major | Major | - | Intermediate | Major | Intermediate |
To determine price objectives, it is also possible to use the pivot points. Here is the price position in relation to pivot points:
| Pivot points | S3 | S2 | S1 | PP | R1 | R2 | R3 |
|---|---|---|---|---|---|---|---|
| Standard | 0.6898 | 0.6929 | 0.6976 | 0.7007 | 0.7054 | 0.7085 | 0.7132 |
| Camarilla | 0.7002 | 0.7009 | 0.7016 | 0.7023 | 0.7030 | 0.7037 | 0.7044 |
| Woodie | 0.6906 | 0.6933 | 0.6984 | 0.7011 | 0.7062 | 0.7089 | 0.7140 |
| Fibonacci | 0.6929 | 0.6959 | 0.6977 | 0.7007 | 0.7037 | 0.7055 | 0.7085 |
| Pivot points | S3 | S2 | S1 | PP | R1 | R2 | R3 |
|---|---|---|---|---|---|---|---|
| Standard | 0.8149 | 0.8205 | 0.8286 | 0.8342 | 0.8423 | 0.8479 | 0.8560 |
| Camarilla | 0.8329 | 0.8342 | 0.8354 | 0.8367 | 0.8380 | 0.8392 | 0.8405 |
| Woodie | 0.8162 | 0.8211 | 0.8299 | 0.8348 | 0.8436 | 0.8485 | 0.8573 |
| Fibonacci | 0.8205 | 0.8257 | 0.8290 | 0.8342 | 0.8394 | 0.8427 | 0.8479 |
| Pivot points | S3 | S2 | S1 | PP | R1 | R2 | R3 |
|---|---|---|---|---|---|---|---|
| Standard | 0.6165 | 0.6332 | 0.6501 | 0.6668 | 0.6837 | 0.7004 | 0.7173 |
| Camarilla | 0.6577 | 0.6607 | 0.6638 | 0.6669 | 0.6700 | 0.6731 | 0.6761 |
| Woodie | 0.6165 | 0.6333 | 0.6501 | 0.6669 | 0.6837 | 0.7005 | 0.7173 |
| Fibonacci | 0.6332 | 0.6461 | 0.6540 | 0.6668 | 0.6797 | 0.6876 | 0.7004 |
Numerical data
The following is the status of the technical indicators and moving averages at the time of publication of this technical analysis:
| RSI (14): | 54.31 | |
| MACD (12,26,9): | 0.0046 | |
| Directional Movement: | 6.0535 | |
| AROON (14): | 85.7142 | |
| DEMA (21): | 0.6805 | |
| Parabolic SAR (0,02-0,02-0,2): | 0.6774 | |
| Elder Ray (13): | 0.0021 | |
| Super Trend (3,10): | 0.6782 | |
| Zig ZAG (10): | 0.6807 | |
| VORTEX (21): | 1.0785 | |
| Stochastique (14,3,5): | 77.52 | |
| TEMA (21): | 0.6870 | |
| Williams %R (14): | -51.55 | |
| Chande Momentum Oscillator (20): | 0.0136 | |
| Repulse (5,40,3): | 0.8330 | |
| ROCnROLL: | 1 | |
| TRIX (15,9): | 0.0397 | |
| Courbe Coppock: | 6.18 |
| MA7: | 0.6841 | |
| MA20: | 0.6721 | |
| MA50: | 0.6746 | |
| MA100: | 0.6842 | |
| MAexp7: | 0.6834 | |
| MAexp20: | 0.6760 | |
| MAexp50: | 0.6761 | |
| MAexp100: | 0.6831 | |
| Price / MA7: | -0.51% | |
| Price / MA20: | +1.26% | |
| Price / MA50: | +0.89% | |
| Price / MA100: | -0.53% | |
| Price / MAexp7: | -0.41% | |
| Price / MAexp20: | +0.68% | |
| Price / MAexp50: | +0.67% | |
| Price / MAexp100: | -0.37% |
News
Don"t forget to follow the news on AUD/CHF. At the time of publication of this analysis, the latest news was as follows:
-
 Forex Strategy Video: Why AUD/CHF May Have More Attractive Qualities than GBP/USD
-
AUD/CHF Technical Levels
About author

Online


Add a comment
Comments
0 comments on the analysis AUD/CHF - Daily