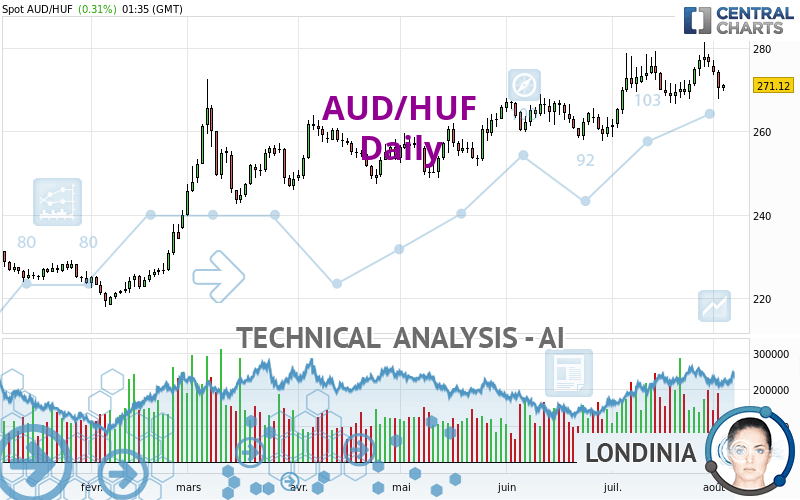
AUD/HUF - Daily - Technical analysis published on 08/03/2022 (GMT)
- 162
- 0
Click here for a new analysis!
- Timeframe : Daily
- - Analysis generated on
- Status : TARGET REACHED

Summary of the analysis

Additional analysis
Quotes
The AUD/HUF price is 271.12 HUF. On the day, this instrument gained +0.31% and was traded between 269.56 HUF and 271.28 HUF over the period. The price is currently at +0.58% from its lowest and -0.06% from its highest.A bearish opening was detected by the Central Gaps scanner. Sellers are trying to impose a bearish trend in the very short term.
Bearish opening
Type : Bearish
Timeframe : Openning
A study of price movements over other periods shows the following variations:
Near a new HIGH record (5 years)
Type : Bullish
Timeframe : Weekly
Near a new HIGH record (1 year)
Type : Bullish
Timeframe : Weekly
Near a new HIGH record (1st january)
Type : Bullish
Timeframe : Weekly
Near a new HIGH record (1 month)
Type : Bullish
Timeframe : Weekly
Technical
A technical analysis in Daily of this AUD/HUF chart shows a bullish trend. The signals given by moving averages are 71.43% bullish. This bullish trend could slow down given the neutral signals currently being given by short-term moving averages. The Central Indicators market scanner is currently detecting a bearish signal that could impact this trend:
Bearish trend reversal : adaptative moving average 20
Type : Bearish
Timeframe : Daily
In fact, of the 18 technical indicators analysed by Central Analyzer, 5 are bullish, 7 are neutral and 6 are bearish. Other results related to technical indicators were also found by the Central Indicators scanner:
RSI indicator is back over 50
Type : Bullish
Timeframe : Daily
Price is back over the pivot point
Type : Bullish
Timeframe : Daily
Price is back under the pivot point
Type : Bearish
Timeframe : Weekly
The Central Patterns scanner, which studies chart patterns, resistances and supports, has identified these signals:
Near support of channel
Type : Bullish
Timeframe : Daily
Near support of triangle
Type : Bullish
Timeframe : Daily
The Central Candlesticks scanner, specialised in Japanese candlesticks, did not identify any signals.
| S3 | S2 | S1 | Price | R1 | |
|---|---|---|---|---|---|
| ProTrendLines | 239.84 | 256.33 | 265.61 | 271.12 | 275.72 |
| Change (%) | -11.54% | -5.46% | -2.03% | - | +1.70% |
| Change | -31.28 | -14.79 | -5.51 | - | +4.60 |
| Level | Intermediate | Major | Intermediate | - | Major |
To determine price objectives, it is also possible to use the pivot points. Here is the price position in relation to pivot points:
| Pivot points | S3 | S2 | S1 | PP | R1 | R2 | R3 |
|---|---|---|---|---|---|---|---|
| Standard | 260.39 | 264.10 | 267.19 | 270.90 | 273.99 | 277.70 | 280.79 |
| Camarilla | 268.42 | 269.04 | 269.67 | 270.29 | 270.91 | 271.54 | 272.16 |
| Woodie | 260.09 | 263.95 | 266.89 | 270.75 | 273.69 | 277.55 | 280.49 |
| Fibonacci | 264.10 | 266.69 | 268.30 | 270.90 | 273.49 | 275.10 | 277.70 |
| Pivot points | S3 | S2 | S1 | PP | R1 | R2 | R3 |
|---|---|---|---|---|---|---|---|
| Standard | 255.50 | 261.62 | 269.14 | 275.26 | 282.78 | 288.90 | 296.42 |
| Camarilla | 272.91 | 274.16 | 275.41 | 276.66 | 277.91 | 279.16 | 280.41 |
| Woodie | 256.20 | 261.97 | 269.84 | 275.61 | 283.48 | 289.25 | 297.12 |
| Fibonacci | 261.62 | 266.83 | 270.05 | 275.26 | 280.47 | 283.69 | 288.90 |
| Pivot points | S3 | S2 | S1 | PP | R1 | R2 | R3 |
|---|---|---|---|---|---|---|---|
| Standard | 240.17 | 249.35 | 263.01 | 272.19 | 285.85 | 295.03 | 308.69 |
| Camarilla | 270.38 | 272.47 | 274.57 | 276.66 | 278.75 | 280.85 | 282.94 |
| Woodie | 242.40 | 250.47 | 265.24 | 273.31 | 288.08 | 296.15 | 310.92 |
| Fibonacci | 249.35 | 258.08 | 263.47 | 272.19 | 280.92 | 286.31 | 295.03 |
Numerical data
The following is the status of technical indicators and moving averages registered at the time this technical analysis was created:
| RSI (14): | 50.90 | |
| MACD (12,26,9): | 1.9400 | |
| Directional Movement: | 2.24 | |
| AROON (14): | 42.86 | |
| DEMA (21): | 274.47 | |
| Parabolic SAR (0,02-0,02-0,2): | 281.11 | |
| Elder Ray (13): | -2.19 | |
| Super Trend (3,10): | 263.89 | |
| Zig ZAG (10): | 271.10 | |
| VORTEX (21): | 1.0500 | |
| Stochastique (14,3,5): | 35.96 | |
| TEMA (21): | 274.22 | |
| Williams %R (14): | -69.13 | |
| Chande Momentum Oscillator (20): | 1.91 | |
| Repulse (5,40,3): | -0.5400 | |
| ROCnROLL: | -1 | |
| TRIX (15,9): | 0.1300 | |
| Courbe Coppock: | 1.04 |
| MA7: | 274.61 | |
| MA20: | 272.55 | |
| MA50: | 267.37 | |
| MA100: | 261.01 | |
| MAexp7: | 272.97 | |
| MAexp20: | 271.64 | |
| MAexp50: | 267.25 | |
| MAexp100: | 260.42 | |
| Price / MA7: | -1.27% | |
| Price / MA20: | -0.52% | |
| Price / MA50: | +1.40% | |
| Price / MA100: | +3.87% | |
| Price / MAexp7: | -0.68% | |
| Price / MAexp20: | -0.19% | |
| Price / MAexp50: | +1.45% | |
| Price / MAexp100: | +4.11% |
About author
Online


Add a comment
Comments
0 comments on the analysis AUD/HUF - Daily