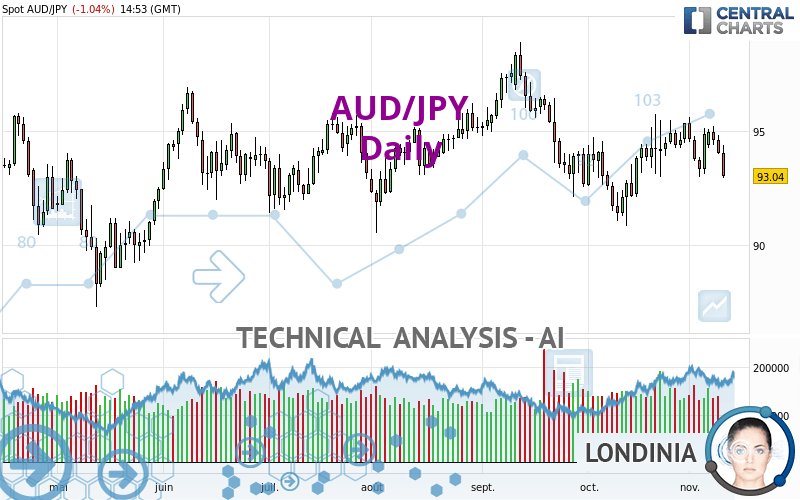
AUD/JPY - Daily - Technical analysis published on 11/10/2022 (GMT)
- 114
- 0
Click here for a new analysis!
- Timeframe : Daily
- - Analysis generated on
- Status : INVALID

Summary of the analysis

Additional analysis
Quotes
The AUD/JPY price is 93.04 JPY. The price is lower by -1.04% since the last closing and was traded between 92.95 JPY and 94.36 JPY over the period. The price is currently at +0.10% from its lowest and -1.40% from its highest.A study of price movements over other periods shows the following variations:
Near a new HIGH record (5 years)
Type : Bullish
Timeframe : Weekly
Near a new HIGH record (1 year)
Type : Bullish
Timeframe : Weekly
Near a new HIGH record (1st january)
Type : Bullish
Timeframe : Weekly
Near a new LOW record (1 month)
Type : Bearish
Timeframe : Weekly
Technical
Technical analysis of AUD/JPY in Daily shows an overall bearish trend. The signals given by moving averages are at 67.86% bearish. This bearish trend shows slight signs of slowing down given the slightly bearish signals of short-term moving averages. The Central Indicators market scanner is currently detecting several bearish signals that could impact this trend:
Bearish trend reversal : adaptative moving average 20
Type : Bearish
Timeframe : Daily
Bearish trend reversal : adaptative moving average 50
Type : Bearish
Timeframe : Daily
Bearish price crossover with adaptative moving average 20
Type : Bearish
Timeframe : Daily
Bearish price crossover with adaptative moving average 50
Type : Bearish
Timeframe : Daily
Bearish price crossover with adaptative moving average 100
Type : Bearish
Timeframe : Daily
Technical indicators are slightly bearish. There is therefore considerable uncertainty about the continuation of the decline.
Caution: the Central Indicators scanner currently detects an excess:
CCI indicator is oversold : under -100
Type : Neutral
Timeframe : Daily
Williams %R indicator is oversold : under -80
Type : Neutral
Timeframe : Daily
Pivot points : price is under support 1
Type : Neutral
Timeframe : Weekly
Pivot points : price is under support 3
Type : Neutral
Timeframe : Daily
MACD crosses DOWN its Moving Average
Type : Bearish
Timeframe : Daily
Central Patterns, the market scanner focusing on chart patterns, resistances and supports found these results:
Near support of channel
Type : Bullish
Timeframe : Daily
Near support of triangle
Type : Bullish
Timeframe : Daily
Horizontal support is broken
Type : Bearish
Timeframe : Daily
The Central Candlesticks scanner, specialised in Japanese candlesticks, did not identify any signals.
| S3 | S2 | S1 | Price | R1 | R2 | R3 | |
|---|---|---|---|---|---|---|---|
| ProTrendLines | 85.89 | 88.33 | 91.92 | 93.04 | 93.86 | 95.30 | 96.67 |
| Change (%) | -7.68% | -5.06% | -1.20% | - | +0.88% | +2.43% | +3.90% |
| Change | -7.15 | -4.71 | -1.12 | - | +0.82 | +2.26 | +3.63 |
| Level | Intermediate | Intermediate | Major | - | Intermediate | Intermediate | Major |
To determine price objectives, it is also possible to use the pivot points. Here is the price position in relation to pivot points:
| Pivot points | S3 | S2 | S1 | PP | R1 | R2 | R3 |
|---|---|---|---|---|---|---|---|
| Standard | 92.94 | 93.47 | 93.74 | 94.27 | 94.54 | 95.07 | 95.34 |
| Camarilla | 93.80 | 93.87 | 93.95 | 94.02 | 94.09 | 94.17 | 94.24 |
| Woodie | 92.82 | 93.41 | 93.62 | 94.21 | 94.42 | 95.01 | 95.22 |
| Fibonacci | 93.47 | 93.77 | 93.96 | 94.27 | 94.57 | 94.76 | 95.07 |
| Pivot points | S3 | S2 | S1 | PP | R1 | R2 | R3 |
|---|---|---|---|---|---|---|---|
| Standard | 90.72 | 91.85 | 93.32 | 94.45 | 95.92 | 97.05 | 98.52 |
| Camarilla | 94.09 | 94.32 | 94.56 | 94.80 | 95.04 | 95.28 | 95.52 |
| Woodie | 90.90 | 91.94 | 93.50 | 94.54 | 96.10 | 97.14 | 98.70 |
| Fibonacci | 91.85 | 92.84 | 93.45 | 94.45 | 95.44 | 96.05 | 97.05 |
| Pivot points | S3 | S2 | S1 | PP | R1 | R2 | R3 |
|---|---|---|---|---|---|---|---|
| Standard | 87.32 | 89.09 | 92.21 | 93.98 | 97.10 | 98.87 | 101.99 |
| Camarilla | 94.00 | 94.44 | 94.89 | 95.34 | 95.79 | 96.24 | 96.69 |
| Woodie | 88.01 | 89.43 | 92.90 | 94.32 | 97.79 | 99.21 | 102.68 |
| Fibonacci | 89.09 | 90.96 | 92.11 | 93.98 | 95.85 | 97.00 | 98.87 |
Numerical data
The following is the status of technical indicators and moving averages registered at the time this technical analysis was created:
| RSI (14): | 43.87 | |
| MACD (12,26,9): | 0.0100 | |
| Directional Movement: | -2.66 | |
| AROON (14): | -100.00 | |
| DEMA (21): | 94.13 | |
| Parabolic SAR (0,02-0,02-0,2): | 95.47 | |
| Elder Ray (13): | -0.47 | |
| Super Trend (3,10): | 95.65 | |
| Zig ZAG (10): | 93.15 | |
| VORTEX (21): | 1.0600 | |
| Stochastique (14,3,5): | 33.55 | |
| TEMA (21): | 94.23 | |
| Williams %R (14): | -96.55 | |
| Chande Momentum Oscillator (20): | -1.39 | |
| Repulse (5,40,3): | -1.8400 | |
| ROCnROLL: | 2 | |
| TRIX (15,9): | 0.0100 | |
| Courbe Coppock: | 0.58 |
| MA7: | 94.07 | |
| MA20: | 94.18 | |
| MA50: | 94.51 | |
| MA100: | 94.22 | |
| MAexp7: | 94.06 | |
| MAexp20: | 94.12 | |
| MAexp50: | 94.16 | |
| MAexp100: | 93.65 | |
| Price / MA7: | -1.09% | |
| Price / MA20: | -1.21% | |
| Price / MA50: | -1.56% | |
| Price / MA100: | -1.25% | |
| Price / MAexp7: | -1.08% | |
| Price / MAexp20: | -1.15% | |
| Price / MAexp50: | -1.19% | |
| Price / MAexp100: | -0.65% |
News
The latest news and videos published on AUD/JPY at the time of the analysis were as follows:
-
 Risk event for the week: Long #AUDJPY
-
Trade of the Week: long AUD/JPY
-
Market Sentiment Webinar: Positive for USD, Bullish Signal on AUD/JPY
-
US Dollar Price Action Setups: GBP/USD, USD/JPY, AUD/JPY
-
Will AUD/JPY target 84.00? – 12 February 2021
About author

Online


Add a comment
Comments
0 comments on the analysis AUD/JPY - Daily