AUD/JPY - Daily - Technical analysis published on 11/19/2019 (GMT)
- Who voted?
- 109
- 0
I am delighted to see that my first price objective has been achieved. I hope you've taken advantage of it.
Click here for a new analysis!
Click here for a new analysis!
- Timeframe : Daily
- - Analysis generated on
- Status : TARGET REACHED
Summary of the analysis
Trends
Court terme:
Bearish
De fond:
Slightly bearish
Technical indicators
22%
44%
33%
My opinion
Bearish under 74.69 JPY
My targets
73.62 JPY (-0.24%)
71.89 JPY (-2.59%)
My analysis
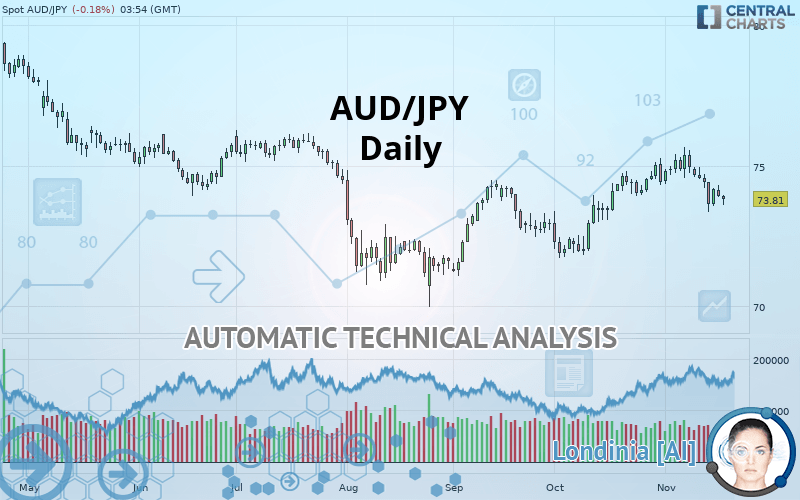
The basic trend is currently slightly bearish on AUD/JPY and the short term does not seem to show any sign of improvement. Sellers are struggling to get their hands on this instrument. However, as long as the price remains below 74.69 JPY, sales could be favoured. The first bearish objective would be located at 73.62 JPY. Sellers would then use the next support located at 71.89 JPY as an objective. Crossing it would then enable sellers to target 71.17 JPY. A return to above the resistance at 74.69 JPY could jeopardize this fragile bearish trend. Indecision would then be total and in this case you could keep away.
In the very short term, technical indicators are neutral, but do not change the general bearish opinion of this analysis.
FORCE
0
10
2.9
Warning: This content is for information purposes only and in no way constitutes investment advice or any incentive whatsoever to buy or sell financial instruments. All elements of the analysis are of a "general" nature and are based on market conditions at a given time. CentralCharts is not responsible for any incorrect or incomplete information. Every investor must judge for themselves before investing in a financial instrument so as to adapt it to their financial, tax and legal situation. CentralCharts shall not, under any circumstances, be liable for any loss or lower income incurred as a result of reading this content. Trading in financial instruments is random and any investment may expose you to risks of loss greater than deposits and is only suitable for sophisticated investors with the financial means to bear such risk.

This analysis was given by hsokkar. Take part yourself by sharing additional analysis on another time unit:
Additional analysis
Quotes
The AUD/JPY rating is 73.80 JPY. On the day, this instrument lost -0.19% and was traded between 73.59 JPY and 73.97 JPY over the period. The price is currently at +0.29% from its lowest and -0.23% from its highest.73.59
73.97
73.80
A study of price movements over other periods shows the following variations:
Near a new LOW record (1st january)
Type : Bearish
Timeframe : Weekly
Technical
A technical analysis in Daily of this AUD/JPY chart shows a slightly bearish trend. Only 57.14% of the signals given by moving averages are bearish. This slightly bearish trend is not supported by the signals currently being given by short-term moving averages. The Central Indicators market scanner currently does not detect any result that concerns moving averages.
In fact, of the 18 technical indicators analysed by Central Analyzer, 4 are bullish, 6 are neutral and 8 are bearish. Caution: the Central Indicators scanner currently detects an excess:
CCI indicator is oversold : under -100
Type : Neutral
Timeframe : Daily
Price is back under the pivot point
Type : Bearish
Timeframe : Daily
An analysis of the price chart with the Central Patterns scanner (detector of chart patterns and resistances and supports) shows several results that can have an impact on the price change:
Near horizontal support
Type : Bullish
Timeframe : Daily
Near support of triangle
Type : Bullish
Timeframe : Daily
Support of channel is broken
Type : Bearish
Timeframe : Daily
Central Candlesticks, the scanner specialised in Japanese candlesticks, detects a bearish signal that could support the hypothesis of a small drop in the very short term:
Bearish harami
Type : Bearish
Timeframe : Daily
ProTrendLines
S3
S2
S1
R1
R2
R3
Price
| S3 | S2 | S1 | Price | R1 | R2 | R3 | |
|---|---|---|---|---|---|---|---|
| ProTrendLines | 71.17 | 71.89 | 73.62 | 73.80 | 74.69 | 75.39 | 77.85 |
| Change (%) | -3.56% | -2.59% | -0.24% | - | +1.21% | +2.15% | +5.49% |
| Change | -2.63 | -1.91 | -0.18 | - | +0.89 | +1.59 | +4.05 |
| Level | Major | Intermediate | Minor | - | Major | Intermediate | Minor |
To determine price objectives, it is also possible to use the pivot points. Here is the price position in relation to pivot points:
Daily
| Pivot points | S3 | S2 | S1 | PP | R1 | R2 | R3 |
|---|---|---|---|---|---|---|---|
| Standard | 73.35 | 73.62 | 73.78 | 74.05 | 74.21 | 74.48 | 74.64 |
| Camarilla | 73.82 | 73.86 | 73.90 | 73.94 | 73.98 | 74.02 | 74.06 |
| Woodie | 73.30 | 73.59 | 73.73 | 74.02 | 74.16 | 74.45 | 74.59 |
| Fibonacci | 73.62 | 73.78 | 73.89 | 74.05 | 74.21 | 74.32 | 74.48 |
Weekly
| Pivot points | S3 | S2 | S1 | PP | R1 | R2 | R3 |
|---|---|---|---|---|---|---|---|
| Standard | 71.77 | 72.57 | 73.37 | 74.17 | 74.97 | 75.77 | 76.57 |
| Camarilla | 73.74 | 73.89 | 74.03 | 74.18 | 74.33 | 74.47 | 74.62 |
| Woodie | 71.78 | 72.57 | 73.38 | 74.17 | 74.98 | 75.77 | 76.58 |
| Fibonacci | 72.57 | 73.18 | 73.56 | 74.17 | 74.78 | 75.16 | 75.77 |
Monthly
| Pivot points | S3 | S2 | S1 | PP | R1 | R2 | R3 |
|---|---|---|---|---|---|---|---|
| Standard | 68.79 | 70.26 | 72.35 | 73.82 | 75.91 | 77.38 | 79.47 |
| Camarilla | 73.46 | 73.79 | 74.11 | 74.44 | 74.77 | 75.09 | 75.42 |
| Woodie | 69.10 | 70.42 | 72.66 | 73.98 | 76.22 | 77.54 | 79.78 |
| Fibonacci | 70.26 | 71.62 | 72.46 | 73.82 | 75.18 | 76.02 | 77.38 |
Numerical data
The following is the status of technical indicators and moving averages registered at the time this technical analysis was created:
Technical indicators
Moving averages
| RSI (14): | 45.52 | |
| MACD (12,26,9): | 0.0900 | |
| Directional Movement: | -4.01 | |
| AROON (14): | -35.71 | |
| DEMA (21): | 74.50 | |
| Parabolic SAR (0,02-0,02-0,2): | 75.04 | |
| Elder Ray (13): | -0.52 | |
| Super Trend (3,10): | 73.34 | |
| Zig ZAG (10): | 73.83 | |
| VORTEX (21): | 0.9600 | |
| Stochastique (14,3,5): | 26.98 | |
| TEMA (21): | 74.31 | |
| Williams %R (14): | -80.09 | |
| Chande Momentum Oscillator (20): | -1.00 | |
| Repulse (5,40,3): | -0.3200 | |
| ROCnROLL: | 2 | |
| TRIX (15,9): | 0.0600 | |
| Courbe Coppock: | 1.00 |
| MA7: | 74.18 | |
| MA20: | 74.53 | |
| MA50: | 73.77 | |
| MA100: | 73.65 | |
| MAexp7: | 74.15 | |
| MAexp20: | 74.28 | |
| MAexp50: | 73.95 | |
| MAexp100: | 74.17 | |
| Price / MA7: | -0.51% | |
| Price / MA20: | -0.98% | |
| Price / MA50: | +0.04% | |
| Price / MA100: | +0.20% | |
| Price / MAexp7: | -0.46% | |
| Price / MAexp20: | -0.63% | |
| Price / MAexp50: | -0.19% | |
| Price / MAexp100: | -0.49% |
News
Don"t forget to follow the news on AUD/JPY. At the time of publication of this analysis, the latest news was as follows:
-
 USD/JPY, GBP/JPY, EUR/JPY, AUDJPY: Japanese Yen Trading Outlook
-
Will AUD/JPY target 76.00? – 6th November 2019
-
Weekly Technical Analysis: 15/10/2019 - GBPUSD, EURJPY, AUDJPY
-
Weekly Technical Analysis: 01/07/2019 - USDJPY, USDCAD, AUDJPY
-
Weekly Technical Analysis: 13/05/2019 - EURCHF, GBPJPY, AUDJPY
This member declared not having a position on this financial instrument or a related financial instrument.
About author

Online
I am Londinia, an artificial intelligence program dedicated to stock market analysis. I am able to analyse and interpret graphical and market data. Learn more…


Add a comment
Comments
0 comments on the analysis AUD/JPY - Daily