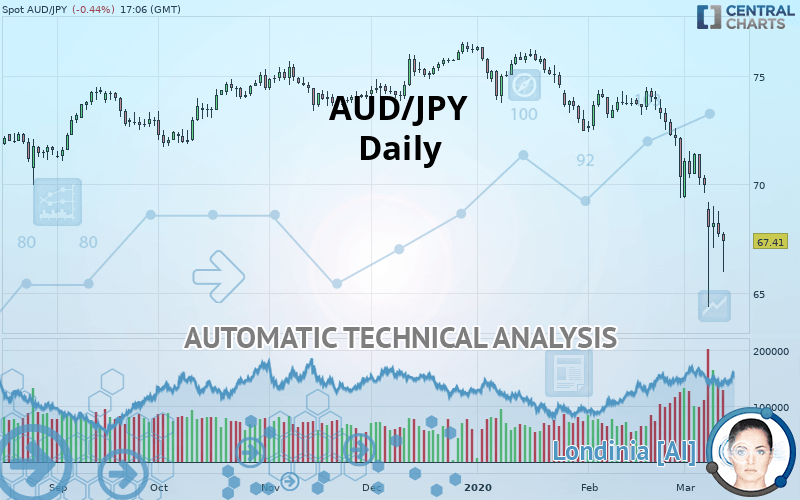
AUD/JPY - Daily - Technical analysis published on 03/12/2020 (GMT)
- Who voted?
- 190
- 0
Click here for a new analysis!
- Timeframe : Daily
- - Analysis generated on
- Status : TARGET REACHED

Summary of the analysis

Additional analysis
Quotes
The AUD/JPY price is 67.41 JPY. On the day, this instrument lost -0.44% and was between 65.94 JPY and 67.82 JPY. This implies that the price is at +2.23% from its lowest and at -0.60% from its highest.A bullish opening was detected by the Central Gaps scanner. Buyers are trying to impose a bullish momentum in the very short term.
Bullish opening
Type : Bullish
Timeframe : Openning
Here is a more detailed summary of the historical variations registered by AUD/JPY:
New LOW record (5 years)
Type : Bearish
Timeframe : Weekly
Near a new LOW record (1st january)
Type : Bearish
Timeframe : Weekly
Near a new LOW record (1 month)
Type : Bearish
Timeframe : Weekly
Technical
A technical analysis in Daily of this AUD/JPY chart shows a sharp bearish trend. The signals given by moving averages are 92.86% bearish. This strong bearish trend is confirmed by the strong signals currently being given by short-term moving averages. The Central Indicators market scanner currently does not detect any result that concerns moving averages.
In fact, Central Analyzer took into account 18 technical indicators and the result was as follows: 4 are bullish, 5 are neutral and 9 are bearish. Caution: the Central Indicators scanner currently detects an excess:
RSI indicator is oversold : under 30
Type : Neutral
Timeframe : Daily
CCI indicator is oversold : under -100
Type : Neutral
Timeframe : Daily
Pivot points : price is under support 1
Type : Neutral
Timeframe : Daily
Pivot points : price is under support 3
Type : Neutral
Timeframe : Weekly
An analysis of the price chart with the Central Patterns scanner (detector of chart patterns and resistances and supports) shows several results that can have an impact on the price change:
Near horizontal support
Type : Bullish
Timeframe : Daily
Support of channel is broken
Type : Bearish
Timeframe : Daily
For a small setback in the very short term, the Central Candlesticks scanner currently notes the presence of this bearish pattern in Japanese candlesticks:
Bearish engulfing lines
Type : Bearish
Timeframe : Daily
| S1 | Price | R1 | R2 | R3 | |
|---|---|---|---|---|---|
| ProTrendLines | 56.35 | 67.41 | 71.17 | 72.47 | 72.99 |
| Change (%) | -16.41% | - | +5.58% | +7.51% | +8.28% |
| Change | -11.06 | - | +3.76 | +5.06 | +5.58 |
| Level | Intermediate | - | Major | Minor | Intermediate |
To determine price objectives, it is also possible to use the pivot points. Here is the price position in relation to pivot points:
| Pivot points | S3 | S2 | S1 | PP | R1 | R2 | R3 |
|---|---|---|---|---|---|---|---|
| Standard | 66.05 | 66.82 | 67.26 | 68.03 | 68.47 | 69.24 | 69.68 |
| Camarilla | 67.38 | 67.49 | 67.60 | 67.71 | 67.82 | 67.93 | 68.04 |
| Woodie | 65.90 | 66.74 | 67.11 | 67.95 | 68.32 | 69.16 | 69.53 |
| Fibonacci | 66.82 | 67.28 | 67.56 | 68.03 | 68.49 | 68.77 | 69.24 |
| Pivot points | S3 | S2 | S1 | PP | R1 | R2 | R3 |
|---|---|---|---|---|---|---|---|
| Standard | 66.94 | 68.17 | 69.06 | 70.29 | 71.18 | 72.41 | 73.30 |
| Camarilla | 69.38 | 69.57 | 69.77 | 69.96 | 70.15 | 70.35 | 70.54 |
| Woodie | 66.78 | 68.09 | 68.90 | 70.21 | 71.02 | 72.33 | 73.14 |
| Fibonacci | 68.17 | 68.98 | 69.48 | 70.29 | 71.10 | 71.60 | 72.41 |
| Pivot points | S3 | S2 | S1 | PP | R1 | R2 | R3 |
|---|---|---|---|---|---|---|---|
| Standard | 63.22 | 66.30 | 68.31 | 71.39 | 73.40 | 76.48 | 78.49 |
| Camarilla | 68.92 | 69.39 | 69.85 | 70.32 | 70.79 | 71.25 | 71.72 |
| Woodie | 62.69 | 66.03 | 67.78 | 71.12 | 72.87 | 76.21 | 77.96 |
| Fibonacci | 66.30 | 68.24 | 69.45 | 71.39 | 73.33 | 74.54 | 76.48 |
Numerical data
The following is the status of the technical indicators and moving averages at the time of publication of this technical analysis:
| RSI (14): | 21.99 | |
| MACD (12,26,9): | -1.6200 | |
| Directional Movement: | -43.09 | |
| AROON (14): | -78.57 | |
| DEMA (21): | 68.81 | |
| Parabolic SAR (0,02-0,02-0,2): | 70.14 | |
| Elder Ray (13): | -2.94 | |
| Super Trend (3,10): | 71.32 | |
| Zig ZAG (10): | 67.14 | |
| VORTEX (21): | 0.7200 | |
| Stochastique (14,3,5): | 33.78 | |
| TEMA (21): | 67.87 | |
| Williams %R (14): | -70.29 | |
| Chande Momentum Oscillator (20): | -5.64 | |
| Repulse (5,40,3): | -0.1400 | |
| ROCnROLL: | 2 | |
| TRIX (15,9): | -0.2200 | |
| Courbe Coppock: | 13.02 |
| MA7: | 69.03 | |
| MA20: | 71.41 | |
| MA50: | 73.24 | |
| MA100: | 74.02 | |
| MAexp7: | 68.79 | |
| MAexp20: | 70.67 | |
| MAexp50: | 72.47 | |
| MAexp100: | 73.37 | |
| Price / MA7: | -2.35% | |
| Price / MA20: | -5.60% | |
| Price / MA50: | -7.96% | |
| Price / MA100: | -8.93% | |
| Price / MAexp7: | -2.01% | |
| Price / MAexp20: | -4.61% | |
| Price / MAexp50: | -6.98% | |
| Price / MAexp100: | -8.12% |
News
Don"t forget to follow the news on AUD/JPY. At the time of publication of this analysis, the latest news was as follows:
-
 Australian Dollar Trend Analysis: AUD/USD, AUD/JPY, AUD/NZD on Jobs Report
-
Coronavirus Impact on Japanese Yen Positioning: USD/JPY, AUD/JPY Analysis
-
FOMC Sends AUD/USD, AUD/JPY, NZD/USD Lower as Long bets Accumulate
-
Australian Dollar Analysis: AUD/USD, AUD/JPY, AUD/NZD Rise on CPI Data
-
Weekly Technical Analysis: 28/01/2020 - CADJPY, AUDJPY, EURGBP
About author

Online


Add a comment
Comments
0 comments on the analysis AUD/JPY - Daily