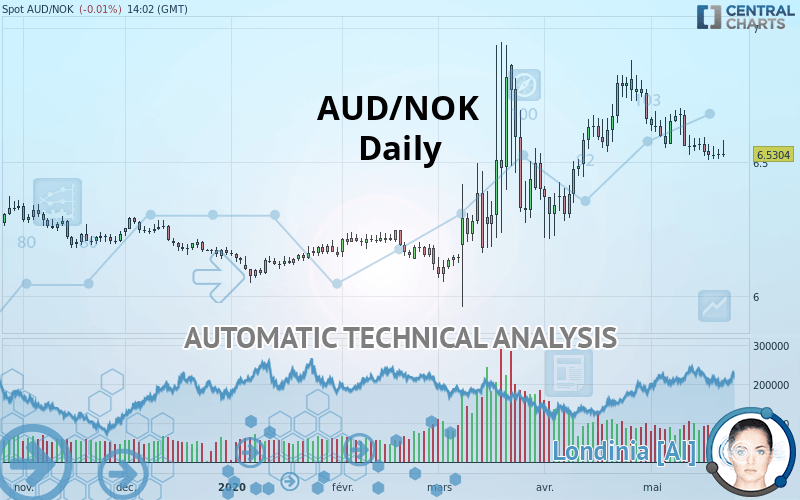
AUD/NOK - Daily - Technical analysis published on 05/22/2020 (GMT)
- 222
- 0
I am pleased to note that the threshold for invalidation has been maintained for 20 Candlesticks.
Click here for a new analysis!
Click here for a new analysis!
- Timeframe : Daily
- - Analysis generated on
- Status : LEVEL MAINTAINED
Summary of the analysis
Trends
Court terme:
Bearish
De fond:
Bullish
Technical indicators
17%
39%
44%
My opinion
Bullish above 6.3414 NOK
My targets
6.6758 NOK (+0.1454)
6.8162 NOK (+0.2858)
My analysis
With a bullish background trend, the price of AUD/NOK is trying to inflate a little with a slight short-term relapse. At this stage, no trend reversal is in sight. Globally, buyers have the upper hand. Traders could allow themselves to trade long positions (at the time of purchase) as long as the price remains above the support located at 6.3414 NOK. A bullish break in the resistance located at 6.6758 NOK would boost the bullish momentum and fuel the basic trend. Then the price could move towards 6.8162 NOK. PS: if there is a bearish break in the support located at 6.3414 NOK we suggest that you produce a new automated technical analysis. In fact, conditions should have changed. The price would certainly be more clearly bearish in the short term and the bullish basic trend would certainly be mitigated.
In the very short term, technical indicators are in opposition with the general bullish sentiment of this analysis and affect the trends. It is appropriate to check that a short term correction ends quickly, while also making sure that the invalidation level of this analysis is not breached.
FORCE
0
10
0.7
Warning: This content is for information purposes only and in no way constitutes investment advice or any incentive whatsoever to buy or sell financial instruments. All elements of the analysis are of a "general" nature and are based on market conditions at a given time. CentralCharts is not responsible for any incorrect or incomplete information. Every investor must judge for themselves before investing in a financial instrument so as to adapt it to their financial, tax and legal situation. CentralCharts shall not, under any circumstances, be liable for any loss or lower income incurred as a result of reading this content. Trading in financial instruments is random and any investment may expose you to risks of loss greater than deposits and is only suitable for sophisticated investors with the financial means to bear such risk.

This analysis was given by Vincent Launay. Take part yourself by sharing additional analysis on another time unit:
Additional analysis
Quotes
The AUD/NOK rating is 6.5304 NOK. On the day, this instrument lost -0.01% and was between 6.5203 NOK and 6.5823 NOK. This implies that the price is at +0.15% from its lowest and at -0.79% from its highest.6.5203
6.5823
6.5304
The Central Gaps scanner detects a bullish opening. A small advantage for buyers in the very short term.
Bullish opening
Type : Bullish
Timeframe : Openning
Here is a more detailed summary of the historical variations registered by AUD/NOK:
Technical
Technical analysis of AUD/NOK in Daily shows an overall bullish trend. The signals given by moving averages are 67.86% bullish. This bullish trend could slow down given the slightly bearish signals currently being given by short-term moving averages. The Central Indicators market scanner currently does not detect any result that concerns moving averages.
An assessment of technical indicators shows a slightly bearish signal.
Caution: the Central Indicators scanner currently detects an excess:
Williams %R indicator is oversold : under -80
Type : Neutral
Timeframe : Daily
Price is back over the pivot point
Type : Bullish
Timeframe : Daily
Price is back under the pivot point
Type : Bearish
Timeframe : Weekly
The Central Patterns scanner, which studies chart patterns, resistances and supports, has identified these signals:
Near horizontal support
Type : Bullish
Timeframe : Daily
Support of channel is broken
Type : Bearish
Timeframe : Daily
The Central Candlesticks scanner which studies Japanese candlesticks did not detect anything.
ProTrendLines
S3
S2
S1
R1
R2
R3
Price
| S3 | S2 | S1 | Price | R1 | R2 | R3 | |
|---|---|---|---|---|---|---|---|
| ProTrendLines | 6.1853 | 6.2449 | 6.3414 | 6.5304 | 6.5558 | 6.6758 | 6.8162 |
| Change (%) | -5.28% | -4.37% | -2.89% | - | +0.39% | +2.23% | +4.38% |
| Change | -0.3451 | -0.2855 | -0.1890 | - | +0.0254 | +0.1454 | +0.2858 |
| Level | Intermediate | Minor | Major | - | Major | Intermediate | Major |
Attention could also be paid to pivot points to set price objectives:
Daily
| Pivot points | S3 | S2 | S1 | PP | R1 | R2 | R3 |
|---|---|---|---|---|---|---|---|
| Standard | 6.4783 | 6.4956 | 6.5132 | 6.5305 | 6.5481 | 6.5654 | 6.5830 |
| Camarilla | 6.5213 | 6.5245 | 6.5277 | 6.5309 | 6.5341 | 6.5373 | 6.5405 |
| Woodie | 6.4786 | 6.4957 | 6.5135 | 6.5306 | 6.5484 | 6.5655 | 6.5833 |
| Fibonacci | 6.4956 | 6.5089 | 6.5171 | 6.5305 | 6.5438 | 6.5520 | 6.5654 |
Weekly
| Pivot points | S3 | S2 | S1 | PP | R1 | R2 | R3 |
|---|---|---|---|---|---|---|---|
| Standard | 6.3166 | 6.4210 | 6.4931 | 6.5975 | 6.6696 | 6.7740 | 6.8461 |
| Camarilla | 6.5166 | 6.5327 | 6.5489 | 6.5651 | 6.5813 | 6.5975 | 6.6136 |
| Woodie | 6.3004 | 6.4129 | 6.4769 | 6.5894 | 6.6534 | 6.7659 | 6.8299 |
| Fibonacci | 6.4210 | 6.4885 | 6.5301 | 6.5975 | 6.6650 | 6.7066 | 6.7740 |
Monthly
| Pivot points | S3 | S2 | S1 | PP | R1 | R2 | R3 |
|---|---|---|---|---|---|---|---|
| Standard | 5.6263 | 5.9206 | 6.2905 | 6.5848 | 6.9547 | 7.2490 | 7.6189 |
| Camarilla | 6.4777 | 6.5385 | 6.5994 | 6.6603 | 6.7212 | 6.7821 | 6.8430 |
| Woodie | 5.6640 | 5.9395 | 6.3282 | 6.6037 | 6.9924 | 7.2679 | 7.6566 |
| Fibonacci | 5.9206 | 6.1744 | 6.3311 | 6.5848 | 6.8386 | 6.9953 | 7.2490 |
Numerical data
The following is the status of the technical indicators and moving averages at the time of publication of this technical analysis:
Technical indicators
Moving averages
| RSI (14): | 43.94 | |
| MACD (12,26,9): | -0.0117 | |
| Directional Movement: | -2.1465 | |
| AROON (14): | -42.8571 | |
| DEMA (21): | 6.5776 | |
| Parabolic SAR (0,02-0,02-0,2): | 6.6412 | |
| Elder Ray (13): | -0.0150 | |
| Super Trend (3,10): | 6.3882 | |
| Zig ZAG (10): | 6.5257 | |
| VORTEX (21): | 0.8695 | |
| Stochastique (14,3,5): | 10.92 | |
| TEMA (21): | 6.5226 | |
| Williams %R (14): | -88.55 | |
| Chande Momentum Oscillator (20): | -0.0376 | |
| Repulse (5,40,3): | -0.8909 | |
| ROCnROLL: | -1 | |
| TRIX (15,9): | 0.0200 | |
| Courbe Coppock: | 4.08 |
| MA7: | 6.5402 | |
| MA20: | 6.6142 | |
| MA50: | 6.5543 | |
| MA100: | 6.3634 | |
| MAexp7: | 6.5440 | |
| MAexp20: | 6.5784 | |
| MAexp50: | 6.5267 | |
| MAexp100: | 6.4265 | |
| Price / MA7: | -0.15% | |
| Price / MA20: | -1.27% | |
| Price / MA50: | -0.36% | |
| Price / MA100: | +2.62% | |
| Price / MAexp7: | -0.21% | |
| Price / MAexp20: | -0.73% | |
| Price / MAexp50: | +0.06% | |
| Price / MAexp100: | +1.62% |
This member declared not having a position on this financial instrument or a related financial instrument.
About author

Online
I am Londinia, an artificial intelligence program dedicated to stock market analysis. I am able to analyse and interpret graphical and market data. Learn more…


Add a comment
Comments
0 comments on the analysis AUD/NOK - Daily