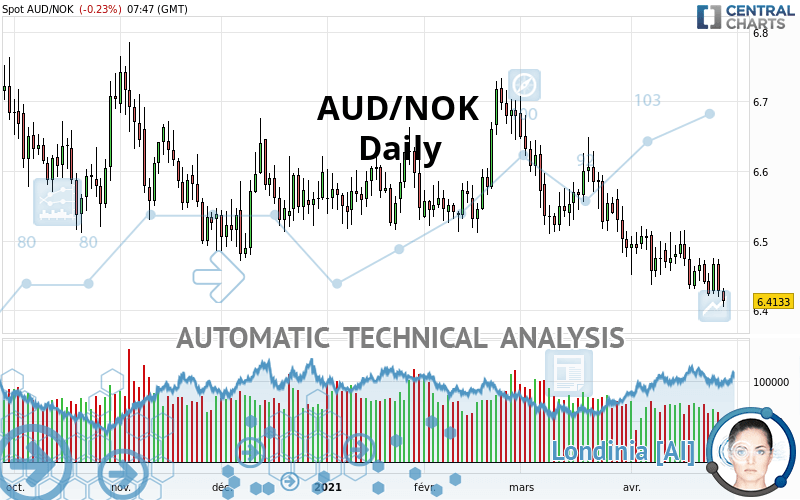
AUD/NOK - Daily - Technical analysis published on 04/28/2021 (GMT)
- 177
- 0
Click here for a new analysis!
- Timeframe : Daily
- - Analysis generated on
- Status : INVALID
Summary of the analysis

Additional analysis
Quotes
The AUD/NOK price is 6.4133 NOK. The price is lower by -0.23% since the last closing and was traded between 6.4050 NOK and 6.4319 NOK over the period. The price is currently at +0.13% from its lowest and -0.29% from its highest.So that you have an overall view of the price change, here is a table showing the variations over several periods:
Near a new HIGH record (1st january)
Type : Bullish
Timeframe : Weekly
Near a new HIGH record (1 month)
Type : Bullish
Timeframe : Weekly
Technical
Technical analysis of this Daily chart of AUD/NOK indicates that the overall trend is strongly bearish. 92.86% of the signals given by moving averages are bearish. This strongly bearish trend is supported by the strong bearish signals given by short-term moving averages. The Central Indicators market scanner currently does not detect any result that concerns moving averages.
In fact, only 8 technical indicators out of 18 studied are currently positioned bearish. But beware of excesses. The Central Indicators scanner currently detects this:
CCI indicator is oversold : under -100
Type : Neutral
Timeframe : Daily
MACD indicator: bearish divergence
Type : Bearish
Timeframe : Daily
Williams %R indicator is oversold : under -80
Type : Neutral
Timeframe : Daily
MACD crosses DOWN its Moving Average
Type : Bearish
Timeframe : Daily
Price is back under the pivot point
Type : Bearish
Timeframe : Daily
Price is back under the pivot point
Type : Bearish
Timeframe : Weekly
Central Patterns, the market scanner focusing on chart patterns, resistances and supports found these results:
Near horizontal support
Type : Bullish
Timeframe : Daily
Support of channel is broken
Type : Bearish
Timeframe : Daily
The presence of a bearish pattern in Japanese candlesticks detected by Central Candlesticks that could cause a correction in the very short term was also detected:
Bearish engulfing lines
Type : Bearish
Timeframe : Daily
| S3 | S2 | S1 | Price | R1 | R2 | R3 | |
|---|---|---|---|---|---|---|---|
| ProTrendLines | 6.0809 | 6.1894 | 6.3478 | 6.4133 | 6.4476 | 6.4809 | 6.5252 |
| Change (%) | -5.18% | -3.49% | -1.02% | - | +0.53% | +1.05% | +1.74% |
| Change | -0.3324 | -0.2239 | -0.0655 | - | +0.0343 | +0.0676 | +0.1119 |
| Level | Minor | Minor | Major | - | Major | Intermediate | Major |
To determine price objectives, it is also possible to use the pivot points. Here is the price position in relation to pivot points:
| Pivot points | S3 | S2 | S1 | PP | R1 | R2 | R3 |
|---|---|---|---|---|---|---|---|
| Standard | 6.3528 | 6.3864 | 6.4071 | 6.4407 | 6.4614 | 6.4950 | 6.5157 |
| Camarilla | 6.4129 | 6.4179 | 6.4228 | 6.4278 | 6.4328 | 6.4378 | 6.4427 |
| Woodie | 6.3464 | 6.3832 | 6.4007 | 6.4375 | 6.4550 | 6.4918 | 6.5093 |
| Fibonacci | 6.3864 | 6.4071 | 6.4200 | 6.4407 | 6.4614 | 6.4743 | 6.4950 |
| Pivot points | S3 | S2 | S1 | PP | R1 | R2 | R3 |
|---|---|---|---|---|---|---|---|
| Standard | 6.3296 | 6.3754 | 6.3995 | 6.4453 | 6.4694 | 6.5152 | 6.5393 |
| Camarilla | 6.4043 | 6.4107 | 6.4171 | 6.4235 | 6.4299 | 6.4363 | 6.4427 |
| Woodie | 6.3187 | 6.3700 | 6.3886 | 6.4399 | 6.4585 | 6.5098 | 6.5284 |
| Fibonacci | 6.3754 | 6.4021 | 6.4186 | 6.4453 | 6.4720 | 6.4885 | 6.5152 |
| Pivot points | S3 | S2 | S1 | PP | R1 | R2 | R3 |
|---|---|---|---|---|---|---|---|
| Standard | 6.1790 | 6.3280 | 6.4091 | 6.5581 | 6.6392 | 6.7882 | 6.8693 |
| Camarilla | 6.4268 | 6.4479 | 6.4690 | 6.4901 | 6.5112 | 6.5323 | 6.5534 |
| Woodie | 6.1450 | 6.3110 | 6.3751 | 6.5411 | 6.6052 | 6.7712 | 6.8353 |
| Fibonacci | 6.3280 | 6.4159 | 6.4702 | 6.5581 | 6.6460 | 6.7003 | 6.7882 |
Numerical data
The following are the details of the technical indicators and moving averages that were collected to generate this technical analysis:
| RSI (14): | 37.96 | |
| MACD (12,26,9): | -0.0282 | |
| Directional Movement: | -8.1504 | |
| AROON (14): | -57.1429 | |
| DEMA (21): | 6.4312 | |
| Parabolic SAR (0,02-0,02-0,2): | 6.4894 | |
| Elder Ray (13): | -0.0355 | |
| Super Trend (3,10): | 6.5481 | |
| Zig ZAG (10): | 6.4149 | |
| VORTEX (21): | 0.9116 | |
| Stochastique (14,3,5): | 22.72 | |
| TEMA (21): | 6.4239 | |
| Williams %R (14): | -90.08 | |
| Chande Momentum Oscillator (20): | -0.0527 | |
| Repulse (5,40,3): | -0.5953 | |
| ROCnROLL: | 2 | |
| TRIX (15,9): | -0.0618 | |
| Courbe Coppock: | 1.34 |
| MA7: | 6.4429 | |
| MA20: | 6.4669 | |
| MA50: | 6.5404 | |
| MA100: | 6.5536 | |
| MAexp7: | 6.4404 | |
| MAexp20: | 6.4688 | |
| MAexp50: | 6.5115 | |
| MAexp100: | 6.5389 | |
| Price / MA7: | -0.46% | |
| Price / MA20: | -0.83% | |
| Price / MA50: | -1.94% | |
| Price / MA100: | -2.14% | |
| Price / MAexp7: | -0.42% | |
| Price / MAexp20: | -0.86% | |
| Price / MAexp50: | -1.51% | |
| Price / MAexp100: | -1.92% |
About author

Online


Add a comment
Comments
0 comments on the analysis AUD/NOK - Daily