AUD/NOK - Daily - Technical analysis published on 01/24/2020 (GMT)
- Who voted?
- 216
- 0
- Timeframe : Daily
- - Analysis generated on
- Status : NEUTRAL
Summary of the analysis

Additional analysis
Quotes
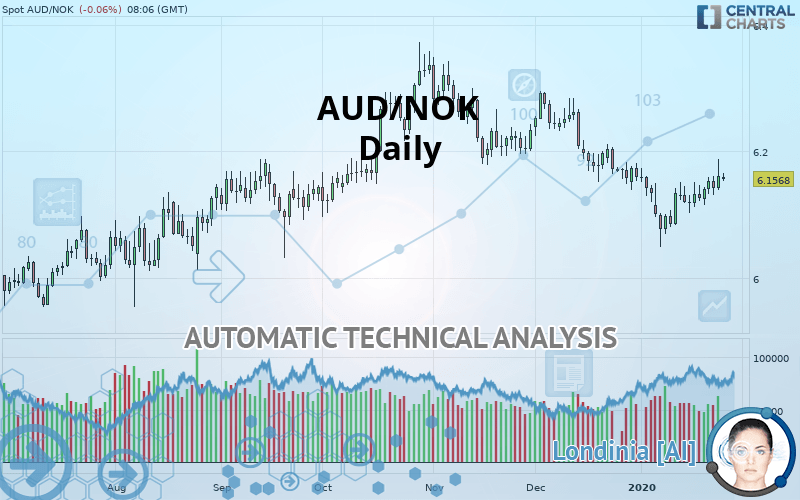
The AUD/NOK rating is 6.1564 NOK. The price registered an increase of -0.06% on the session with the lowest point at 6.1535 NOK and the highest point at 6.1653 NOK. The deviation from the price is +0.05% for the low point and -0.14% for the high point.A bearish opening was detected by the Central Gaps scanner. Sellers are trying to impose a bearish trend in the very short term.
Bearish opening
Type : Bearish
Timeframe : Openning
A study of price movements over other periods shows the following variations:
Technical
A technical analysis in Daily of this AUD/NOK chart shows a slightly bearish trend. 60.71% of the signals given by moving averages are bullish. As the signals currently given by short-term moving averages are rather neutral, the overall trend could quickly return to neutral as well. The Central Indicators market scanner is currently detecting a bullish signal that could impact this trend:
Bullish price crossover with adaptative moving average 100
Type : Bullish
Timeframe : Daily
The probability of a further increase are moderate given the direction of the technical indicators.
But beware of excesses. The Central Indicators scanner currently detects this:
CCI indicator is overbought : over 100
Type : Neutral
Timeframe : Daily
Williams %R indicator is overbought : over -20
Type : Neutral
Timeframe : Daily
Pivot points : price is over resistance 1
Type : Neutral
Timeframe : Weekly
RSI indicator is back over 50
Type : Bullish
Timeframe : Daily
Ichimoku - Bullish crossover : Tenkan & Kijun
Type : Bullish
Timeframe : Daily
Price is back under the pivot point
Type : Bearish
Timeframe : Weekly
Central Patterns, the market scanner focusing on chart patterns, resistances and supports found these results:
Near horizontal resistance
Type : Bearish
Timeframe : Daily
Resistance of channel is broken
Type : Bullish
Timeframe : Daily
Resistance of triangle is broken
Type : Bullish
Timeframe : Daily
Central Candlesticks, the scanner specialised in Japanese candlesticks, detects a bullish signal that could support the hypothesis of a small rebound in the very short term:
Bullish engulfing lines
Type : Bullish
Timeframe : Daily
| S3 | S2 | S1 | Price | R1 | R2 | R3 | |
|---|---|---|---|---|---|---|---|
| ProTrendLines | 5.9498 | 6.0184 | 6.0960 | 6.1564 | 6.1809 | 6.2154 | 6.2837 |
| Change (%) | -3.36% | -2.24% | -0.98% | - | +0.40% | +0.96% | +2.07% |
| Change | -0.2066 | -0.1380 | -0.0604 | - | +0.0245 | +0.0590 | +0.1273 |
| Level | Major | Minor | Major | - | Minor | Intermediate | Major |
To determine price objectives, it is also possible to use the pivot points. Here is the price position in relation to pivot points:
| Pivot points | S3 | S2 | S1 | PP | R1 | R2 | R3 |
|---|---|---|---|---|---|---|---|
| Standard | 6.0885 | 6.1140 | 6.1371 | 6.1626 | 6.1857 | 6.2112 | 6.2343 |
| Camarilla | 6.1469 | 6.1514 | 6.1558 | 6.1603 | 6.1648 | 6.1692 | 6.1737 |
| Woodie | 6.0874 | 6.1134 | 6.1360 | 6.1620 | 6.1846 | 6.2106 | 6.2332 |
| Fibonacci | 6.1140 | 6.1325 | 6.1440 | 6.1626 | 6.1811 | 6.1926 | 6.2112 |
| Pivot points | S3 | S2 | S1 | PP | R1 | R2 | R3 |
|---|---|---|---|---|---|---|---|
| Standard | 6.0514 | 6.0766 | 6.1012 | 6.1264 | 6.1510 | 6.1762 | 6.2008 |
| Camarilla | 6.1121 | 6.1167 | 6.1212 | 6.1258 | 6.1304 | 6.1349 | 6.1395 |
| Woodie | 6.0511 | 6.0765 | 6.1009 | 6.1263 | 6.1507 | 6.1761 | 6.2005 |
| Fibonacci | 6.0766 | 6.0956 | 6.1074 | 6.1264 | 6.1454 | 6.1572 | 6.1762 |
| Pivot points | S3 | S2 | S1 | PP | R1 | R2 | R3 |
|---|---|---|---|---|---|---|---|
| Standard | 5.9427 | 6.0407 | 6.1002 | 6.1982 | 6.2577 | 6.3557 | 6.4152 |
| Camarilla | 6.1164 | 6.1308 | 6.1453 | 6.1597 | 6.1741 | 6.1886 | 6.2030 |
| Woodie | 5.9235 | 6.0311 | 6.0810 | 6.1886 | 6.2385 | 6.3461 | 6.3960 |
| Fibonacci | 6.0407 | 6.1009 | 6.1380 | 6.1982 | 6.2584 | 6.2955 | 6.3557 |
Numerical data
The following are the details of the technical indicators and moving averages that were collected to generate this technical analysis:
| RSI (14): | 51.17 | |
| MACD (12,26,9): | -0.0091 | |
| Directional Movement: | 3.0771 | |
| AROON (14): | 85.7142 | |
| DEMA (21): | 6.1278 | |
| Parabolic SAR (0,02-0,02-0,2): | 6.0945 | |
| Elder Ray (13): | 0.0184 | |
| Super Trend (3,10): | 6.1821 | |
| Zig ZAG (10): | 6.1550 | |
| VORTEX (21): | 0.9969 | |
| Stochastique (14,3,5): | 79.75 | |
| TEMA (21): | 6.1362 | |
| Williams %R (14): | -24.05 | |
| Chande Momentum Oscillator (20): | 0.0565 | |
| Repulse (5,40,3): | -0.0368 | |
| ROCnROLL: | -1 | |
| TRIX (15,9): | -0.0448 | |
| Courbe Coppock: | 0.52 |
| MA7: | 6.1441 | |
| MA20: | 6.1321 | |
| MA50: | 6.1829 | |
| MA100: | 6.1933 | |
| MAexp7: | 6.1453 | |
| MAexp20: | 6.1447 | |
| MAexp50: | 6.1681 | |
| MAexp100: | 6.1677 | |
| Price / MA7: | +0.20% | |
| Price / MA20: | +0.40% | |
| Price / MA50: | -0.43% | |
| Price / MA100: | -0.60% | |
| Price / MAexp7: | +0.18% | |
| Price / MAexp20: | +0.19% | |
| Price / MAexp50: | -0.19% | |
| Price / MAexp100: | -0.18% |
About author

Online


Add a comment
Comments
0 comments on the analysis AUD/NOK - Daily