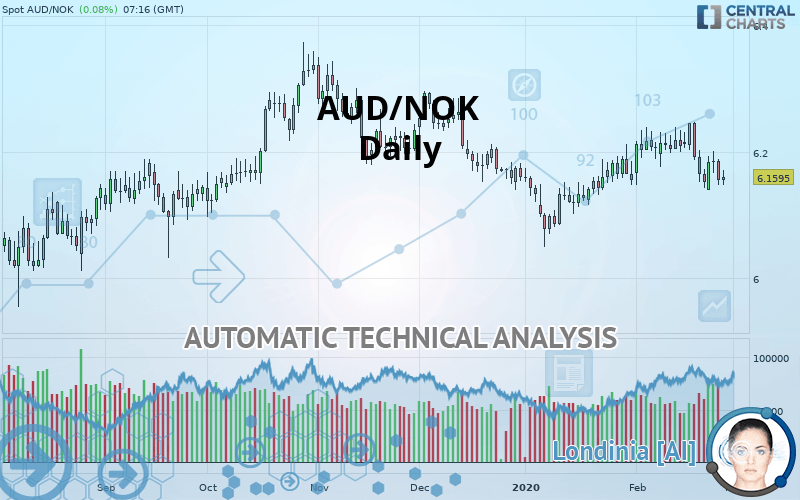
AUD/NOK - Daily - Technical analysis published on 02/27/2020 (GMT)
- Who voted?
- 218
- 0
Click here for a new analysis!
- Timeframe : Daily
- - Analysis generated on
- Status : TARGET REACHED
Summary of the analysis

Additional analysis
Quotes
The AUD/NOK rating is 6.1599 NOK. The price is lower by +0.09% since the last closing and was between 6.1474 NOK and 6.1710 NOK. This implies that the price is at +0.20% from its lowest and at -0.18% from its highest.Here is a more detailed summary of the historical variations registered by AUD/NOK:
Technical
Technical analysis of AUD/NOK in Daily shows an overall bearish trend. The signals given by moving averages are 78.57% bearish. This bearish trend is reinforced by the strong signals currently being given by short-term moving averages. The Central Indicators scanner detects bearish signals on moving averages that could impact this trend:
Bearish trend reversal : Moving Average 20
Type : Bearish
Timeframe : Daily
Bearish trend reversal : Moving Average 100
Type : Bearish
Timeframe : Daily
Bearish trend reversal : adaptative moving average 100
Type : Bearish
Timeframe : Daily
Bearish price crossover with Moving Average 50
Type : Bearish
Timeframe : Daily
Bearish price crossover with adaptative moving average 20
Type : Bearish
Timeframe : Daily
Bearish price crossover with adaptative moving average 50
Type : Bearish
Timeframe : Daily
Bearish price crossover with adaptative moving average 100
Type : Bearish
Timeframe : Daily
An assessment of technical indicators does not currently provide any relevant information on the direction of future price movements.
But beware of excesses. The Central Indicators scanner currently detects this:
CCI indicator is oversold : under -100
Type : Neutral
Timeframe : Daily
Williams %R indicator is oversold : under -80
Type : Neutral
Timeframe : Daily
Price is back under the pivot point
Type : Bearish
Timeframe : Daily
Price is back under the pivot point
Type : Bearish
Timeframe : Weekly
Central Patterns, the market scanner focusing on chart patterns, resistances and supports found these results:
Near horizontal support
Type : Bullish
Timeframe : Daily
Near support of triangle
Type : Bullish
Timeframe : Daily
Support of channel is broken
Type : Bearish
Timeframe : Daily
No result was found by the Central Candlesticks scanner on Japanese candlesticks.
| S3 | S2 | S1 | Price | R1 | R2 | R3 | |
|---|---|---|---|---|---|---|---|
| ProTrendLines | 6.0017 | 6.0746 | 6.1559 | 6.1599 | 6.2154 | 6.2837 | 6.3362 |
| Change (%) | -2.57% | -1.38% | -0.06% | - | +0.90% | +2.01% | +2.86% |
| Change | -0.1582 | -0.0853 | -0.0040 | - | +0.0555 | +0.1238 | +0.1763 |
| Level | Minor | Intermediate | Intermediate | - | Intermediate | Major | Intermediate |
Attention could also be paid to pivot points to set price objectives:
| Pivot points | S3 | S2 | S1 | PP | R1 | R2 | R3 |
|---|---|---|---|---|---|---|---|
| Standard | 6.0973 | 6.1224 | 6.1385 | 6.1636 | 6.1797 | 6.2048 | 6.2209 |
| Camarilla | 6.1432 | 6.1470 | 6.1507 | 6.1545 | 6.1583 | 6.1621 | 6.1658 |
| Woodie | 6.0927 | 6.1202 | 6.1339 | 6.1614 | 6.1751 | 6.2026 | 6.2163 |
| Fibonacci | 6.1224 | 6.1382 | 6.1479 | 6.1636 | 6.1794 | 6.1891 | 6.2048 |
| Pivot points | S3 | S2 | S1 | PP | R1 | R2 | R3 |
|---|---|---|---|---|---|---|---|
| Standard | 6.0082 | 6.0748 | 6.1137 | 6.1803 | 6.2192 | 6.2858 | 6.3247 |
| Camarilla | 6.1235 | 6.1332 | 6.1428 | 6.1525 | 6.1622 | 6.1718 | 6.1815 |
| Woodie | 5.9943 | 6.0679 | 6.0998 | 6.1734 | 6.2053 | 6.2789 | 6.3108 |
| Fibonacci | 6.0748 | 6.1151 | 6.1400 | 6.1803 | 6.2206 | 6.2455 | 6.2858 |
| Pivot points | S3 | S2 | S1 | PP | R1 | R2 | R3 |
|---|---|---|---|---|---|---|---|
| Standard | 5.9019 | 5.9751 | 6.0648 | 6.1380 | 6.2277 | 6.3009 | 6.3906 |
| Camarilla | 6.1097 | 6.1246 | 6.1396 | 6.1545 | 6.1694 | 6.1844 | 6.1993 |
| Woodie | 5.9102 | 5.9792 | 6.0731 | 6.1421 | 6.2360 | 6.3050 | 6.3989 |
| Fibonacci | 5.9751 | 6.0373 | 6.0758 | 6.1380 | 6.2002 | 6.2387 | 6.3009 |
Numerical data
The following are the details of the technical indicators and moving averages that were collected to generate this technical analysis:
| RSI (14): | 44.91 | |
| MACD (12,26,9): | -0.0017 | |
| Directional Movement: | -0.7785 | |
| AROON (14): | -21.4285 | |
| DEMA (21): | 6.1834 | |
| Parabolic SAR (0,02-0,02-0,2): | 6.2253 | |
| Elder Ray (13): | -0.0217 | |
| Super Trend (3,10): | 6.1146 | |
| Zig ZAG (10): | 6.1572 | |
| VORTEX (21): | 0.9867 | |
| Stochastique (14,3,5): | 24.26 | |
| TEMA (21): | 6.1792 | |
| Williams %R (14): | -83.04 | |
| Chande Momentum Oscillator (20): | -0.0520 | |
| Repulse (5,40,3): | -0.2958 | |
| ROCnROLL: | 2 | |
| TRIX (15,9): | 0.0170 | |
| Courbe Coppock: | 0.88 |
| MA7: | 6.1701 | |
| MA20: | 6.1952 | |
| MA50: | 6.1667 | |
| MA100: | 6.2060 | |
| MAexp7: | 6.1737 | |
| MAexp20: | 6.1831 | |
| MAexp50: | 6.1821 | |
| MAexp100: | 6.1772 | |
| Price / MA7: | -0.17% | |
| Price / MA20: | -0.57% | |
| Price / MA50: | -0.11% | |
| Price / MA100: | -0.74% | |
| Price / MAexp7: | -0.22% | |
| Price / MAexp20: | -0.38% | |
| Price / MAexp50: | -0.36% | |
| Price / MAexp100: | -0.28% |
About author

Online


Add a comment
Comments
0 comments on the analysis AUD/NOK - Daily