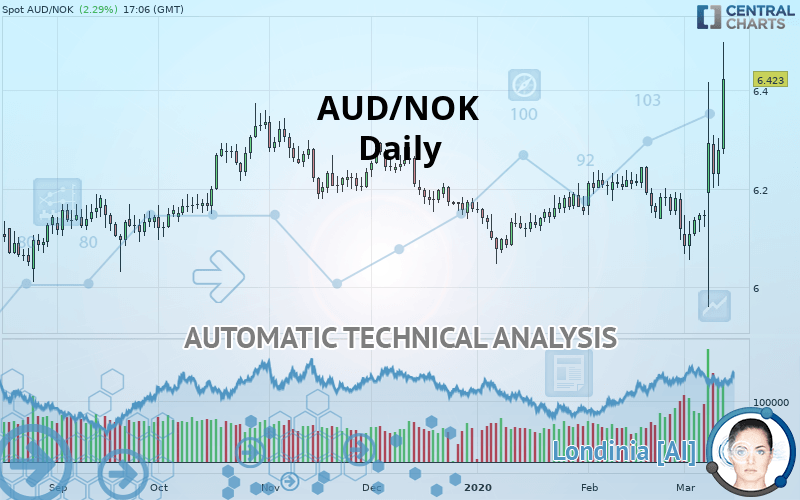
AUD/NOK - Daily - Technical analysis published on 03/12/2020 (GMT)
- Who voted?
- 221
- 0
Click here for a new analysis!
- Timeframe : Daily
- - Analysis generated on
- Status : INVALID

Summary of the analysis

Additional analysis
Quotes
The AUD/NOK rating is 6.4236 NOK. The price has increased by +2.30% since the last closing with the lowest point at 6.2707 NOK and the highest point at 6.4981 NOK. The deviation from the price is +2.44% for the low point and -1.15% for the high point.The Central Gaps scanner detects a bullish opening marking the presence of buyers ahead of sellers at the opening but not sufficiently marked to allow the price to register a quotation gap.
Bullish opening
Type : Bullish
Timeframe : Openning
Here is a more detailed summary of the historical variations registered by AUD/NOK:
New HIGH record (1 year)
Type : Bullish
Timeframe : Weekly
New HIGH record (1st january)
Type : Bullish
Timeframe : Weekly
Near a new LOW record (1st january)
Type : Bearish
Timeframe : Weekly
New HIGH record (1 month)
Type : Bullish
Timeframe : Weekly
Near a new LOW record (1 month)
Type : Bearish
Timeframe : Weekly
Abnormal volumes on AUD/NOK were detected by the Central Volumes scanner:
Abnormal volumes
Timeframe : 5 days
Technical
A technical analysis in Daily of this AUD/NOK chart shows a strongly bullish trend. The signals given by the moving averages are 85.71% bullish. This strong bullish trend is confirmed by the strong signals currently being given by short-term moving averages. The Central Indicators scanner detects a bullish signal on moving averages that could impact this trend:
Moving Average bullish crossovers : AMA50 & AMA100
Type : Bullish
Timeframe : Daily
In fact, 15 technical indicators on 18 studied are currently bullish. Caution: the Central Indicators scanner currently detects an excess:
CCI indicator is overbought : over 100
Type : Neutral
Timeframe : Daily
Williams %R indicator is overbought : over -20
Type : Neutral
Timeframe : Daily
Pivot points : price is over resistance 3
Type : Neutral
Timeframe : Daily
Pivot points : price is over resistance 3
Type : Neutral
Timeframe : Weekly
An analysis of the price chart with the Central Patterns scanner (detector of chart patterns and resistances and supports) shows several results that can have an impact on the price change:
Resistance of channel is broken
Type : Bullish
Timeframe : Daily
Resistance of triangle is broken
Type : Bullish
Timeframe : Daily
The presence of a bullish Japanese candlestick pattern detected by Central Candlesticks that could cause a very short term rebound was also detected:
Bullish harami
Type : Bullish
Timeframe : Daily
| S3 | S2 | S1 | Price | R1 | R2 | |
|---|---|---|---|---|---|---|
| ProTrendLines | 6.2154 | 6.2928 | 6.3414 | 6.4236 | 6.4490 | 6.5558 |
| Change (%) | -3.24% | -2.04% | -1.28% | - | +0.40% | +2.06% |
| Change | -0.2082 | -0.1308 | -0.0822 | - | +0.0254 | +0.1322 |
| Level | Major | Intermediate | Major | - | Major | Intermediate |
Pivot points can also be used to set your price objectives. Here is the price situation in relation to pivot points:
| Pivot points | S3 | S2 | S1 | PP | R1 | R2 | R3 |
|---|---|---|---|---|---|---|---|
| Standard | 6.1251 | 6.1657 | 6.2226 | 6.2632 | 6.3201 | 6.3607 | 6.4176 |
| Camarilla | 6.2527 | 6.2616 | 6.2706 | 6.2795 | 6.2884 | 6.2974 | 6.3063 |
| Woodie | 6.1333 | 6.1698 | 6.2308 | 6.2673 | 6.3283 | 6.3648 | 6.4258 |
| Fibonacci | 6.1657 | 6.2029 | 6.2260 | 6.2632 | 6.3005 | 6.3235 | 6.3607 |
| Pivot points | S3 | S2 | S1 | PP | R1 | R2 | R3 |
|---|---|---|---|---|---|---|---|
| Standard | 5.9780 | 6.0165 | 6.0808 | 6.1193 | 6.1836 | 6.2221 | 6.2864 |
| Camarilla | 6.1168 | 6.1263 | 6.1357 | 6.1451 | 6.1545 | 6.1640 | 6.1734 |
| Woodie | 5.9909 | 6.0230 | 6.0937 | 6.1258 | 6.1965 | 6.2286 | 6.2993 |
| Fibonacci | 6.0165 | 6.0558 | 6.0800 | 6.1193 | 6.1586 | 6.1828 | 6.2221 |
| Pivot points | S3 | S2 | S1 | PP | R1 | R2 | R3 |
|---|---|---|---|---|---|---|---|
| Standard | 5.9114 | 6.0040 | 6.0617 | 6.1543 | 6.2120 | 6.3046 | 6.3623 |
| Camarilla | 6.0780 | 6.0917 | 6.1055 | 6.1193 | 6.1331 | 6.1469 | 6.1606 |
| Woodie | 5.8939 | 5.9953 | 6.0442 | 6.1456 | 6.1945 | 6.2959 | 6.3448 |
| Fibonacci | 6.0040 | 6.0615 | 6.0969 | 6.1543 | 6.2118 | 6.2472 | 6.3046 |
Numerical data
The following is the status of technical indicators and moving averages registered at the time this technical analysis was created:
| RSI (14): | 72.91 | |
| MACD (12,26,9): | 0.0320 | |
| Directional Movement: | 29.2657 | |
| AROON (14): | 21.4286 | |
| DEMA (21): | 6.2416 | |
| Parabolic SAR (0,02-0,02-0,2): | 5.9602 | |
| Elder Ray (13): | 0.1547 | |
| Super Trend (3,10): | 6.0686 | |
| Zig ZAG (10): | 6.4451 | |
| VORTEX (21): | 1.0426 | |
| Stochastique (14,3,5): | 72.67 | |
| TEMA (21): | 6.2677 | |
| Williams %R (14): | -12.60 | |
| Chande Momentum Oscillator (20): | 0.2397 | |
| Repulse (5,40,3): | 3.4151 | |
| ROCnROLL: | 1 | |
| TRIX (15,9): | 0.0076 | |
| Courbe Coppock: | 1.82 |
| MA7: | 6.2373 | |
| MA20: | 6.1946 | |
| MA50: | 6.1732 | |
| MA100: | 6.2034 | |
| MAexp7: | 6.2665 | |
| MAexp20: | 6.2136 | |
| MAexp50: | 6.1926 | |
| MAexp100: | 6.1824 | |
| Price / MA7: | +2.99% | |
| Price / MA20: | +3.70% | |
| Price / MA50: | +4.06% | |
| Price / MA100: | +3.55% | |
| Price / MAexp7: | +2.51% | |
| Price / MAexp20: | +3.38% | |
| Price / MAexp50: | +3.73% | |
| Price / MAexp100: | +3.90% |
About author

Online


Add a comment
Comments
0 comments on the analysis AUD/NOK - Daily