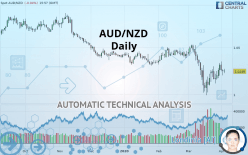
AUD/NZD - Daily - Technical analysis published on 04/03/2020 (GMT)
- Who voted?
- 247
- 0
Oops, I was wrong about that analysis. My threshold for invalidation has been broken.
Click here for a new analysis!
Click here for a new analysis!
- Timeframe : Daily
- - Analysis generated on
- Status : INVALID

Summary of the analysis
Trends
Court terme:
Bearish
De fond:
Strongly bearish
Technical indicators
61%
0%
39%
My opinion
Bearish under 1.0377 NZD
My targets
1.0166 NZD (-0.0083)
1.0073 NZD (-0.0176)
My analysis
The bearish basic trend is very strong on AUD/NZD but the short term shows some signs of running out of steam. However, a sale could be considered as long as the price remains below 1.0377 NZD. Crossing the first support at 1.0166 NZD would be a sign of a further potential price plummet. Sellers would then use the next support located at 1.0073 NZD as an objective. Caution, a return to above the resistance located at 1.0377 NZD would be a sign of a possible consolidation phase of the short-term basic trend. If this is the case, remember that trading against the trend may be riskier. It would seem more appropriate to wait for a signal indicating reversal of the trend.
In the very short term, the general bearish opinion of this analysis is in opposition with technical indicators. As long as the invalidation level of this analysis is not breached, the bearish direction is still favored, however the current short term correction should be carefully watched.
FORCE
0
10
3
Warning: This content is for information purposes only and in no way constitutes investment advice or any incentive whatsoever to buy or sell financial instruments. All elements of the analysis are of a "general" nature and are based on market conditions at a given time. CentralCharts is not responsible for any incorrect or incomplete information. Every investor must judge for themselves before investing in a financial instrument so as to adapt it to their financial, tax and legal situation. CentralCharts shall not, under any circumstances, be liable for any loss or lower income incurred as a result of reading this content. Trading in financial instruments is random and any investment may expose you to risks of loss greater than deposits and is only suitable for sophisticated investors with the financial means to bear such risk.

This analysis was given by Vincent Launay. Take part yourself by sharing additional analysis on another time unit:
Additional analysis
Quotes
The AUD/NZD price is 1.0249 NZD. On the day, this instrument gained -0.04% and was between 1.0228 NZD and 1.0275 NZD. This implies that the price is at +0.21% from its lowest and at -0.25% from its highest.1.0228
1.0275
1.0249
A study of price movements over other periods shows the following variations:
Near a new LOW record (5 years)
Type : Bearish
Timeframe : Weekly
The Central Volumes scanner notes the presence of abnormal volumes:
Abnormal volumes
Timeframe : 20 days
Technical
A technical analysis in Daily of this AUD/NZD chart shows a sharp bearish trend. 85.71% of the signals given by moving averages are bearish. This strongly bearish trend is showing signs of slowing down given the slightly bearish signals given by short-term moving averages. The Central Indicators scanner detects a bearish signal on moving averages that could impact this trend:
Bearish trend reversal : adaptative moving average 20
Type : Bearish
Timeframe : Daily
An assessment of technical indicators shows a moderate bullish signal.
But beware of excesses. The Central Indicators scanner currently detects this:
Williams %R indicator is overbought : over -20
Type : Neutral
Timeframe : Daily
Price is back under the pivot point
Type : Bearish
Timeframe : Weekly
Central Patterns, the market scanner focusing on chart patterns, resistances and supports found these results:
Resistance of channel is broken
Type : Bullish
Timeframe : Daily
Horizontal support is broken
Type : Bearish
Timeframe : Daily
The Central Candlesticks scanner, specialised in Japanese candlesticks, did not identify any signals.
ProTrendLines
S2
S1
R1
R2
R3
Price
| S2 | S1 | Price | R1 | R2 | R3 | |
|---|---|---|---|---|---|---|
| ProTrendLines | 1.0073 | 1.0166 | 1.0249 | 1.0284 | 1.0377 | 1.0441 |
| Change (%) | -1.72% | -0.81% | - | +0.34% | +1.25% | +1.87% |
| Change | -0.0176 | -0.0083 | - | +0.0035 | +0.0128 | +0.0192 |
| Level | Major | Intermediate | - | Major | Intermediate | Intermediate |
Attention could also be paid to pivot points to set price objectives:
Daily
| Pivot points | S3 | S2 | S1 | PP | R1 | R2 | R3 |
|---|---|---|---|---|---|---|---|
| Standard | 1.0152 | 1.0178 | 1.0216 | 1.0242 | 1.0280 | 1.0306 | 1.0344 |
| Camarilla | 1.0235 | 1.0241 | 1.0247 | 1.0253 | 1.0259 | 1.0265 | 1.0271 |
| Woodie | 1.0157 | 1.0181 | 1.0221 | 1.0245 | 1.0285 | 1.0309 | 1.0349 |
| Fibonacci | 1.0178 | 1.0203 | 1.0218 | 1.0242 | 1.0267 | 1.0282 | 1.0306 |
Weekly
| Pivot points | S3 | S2 | S1 | PP | R1 | R2 | R3 |
|---|---|---|---|---|---|---|---|
| Standard | 0.9933 | 1.0026 | 1.0115 | 1.0208 | 1.0297 | 1.0390 | 1.0479 |
| Camarilla | 1.0154 | 1.0171 | 1.0187 | 1.0204 | 1.0221 | 1.0237 | 1.0254 |
| Woodie | 0.9931 | 1.0025 | 1.0113 | 1.0207 | 1.0295 | 1.0389 | 1.0477 |
| Fibonacci | 1.0026 | 1.0096 | 1.0139 | 1.0208 | 1.0278 | 1.0321 | 1.0390 |
Monthly
| Pivot points | S3 | S2 | S1 | PP | R1 | R2 | R3 |
|---|---|---|---|---|---|---|---|
| Standard | 0.9491 | 0.9743 | 1.0029 | 1.0281 | 1.0567 | 1.0819 | 1.1105 |
| Camarilla | 1.0168 | 1.0217 | 1.0267 | 1.0316 | 1.0365 | 1.0415 | 1.0464 |
| Woodie | 0.9509 | 0.9752 | 1.0047 | 1.0290 | 1.0585 | 1.0828 | 1.1123 |
| Fibonacci | 0.9743 | 0.9948 | 1.0075 | 1.0281 | 1.0486 | 1.0613 | 1.0819 |
Numerical data
The following are the details of the technical indicators and moving averages that were collected to generate this technical analysis:
Technical indicators
Moving averages
| RSI (14): | 46.87 | |
| MACD (12,26,9): | -0.0030 | |
| Directional Movement: | -2.4173 | |
| AROON (14): | 71.4286 | |
| DEMA (21): | 1.0210 | |
| Parabolic SAR (0,02-0,02-0,2): | 1.0144 | |
| Elder Ray (13): | 0.0009 | |
| Super Trend (3,10): | 1.0388 | |
| Zig ZAG (10): | 1.0247 | |
| VORTEX (21): | 0.9056 | |
| Stochastique (14,3,5): | 72.63 | |
| TEMA (21): | 1.0214 | |
| Williams %R (14): | -29.05 | |
| Chande Momentum Oscillator (20): | 0.0113 | |
| Repulse (5,40,3): | 0.0677 | |
| ROCnROLL: | -1 | |
| TRIX (15,9): | -0.0684 | |
| Courbe Coppock: | 0.26 |
| MA7: | 1.0245 | |
| MA20: | 1.0225 | |
| MA50: | 1.0344 | |
| MA100: | 1.0396 | |
| MAexp7: | 1.0246 | |
| MAexp20: | 1.0257 | |
| MAexp50: | 1.0322 | |
| MAexp100: | 1.0394 | |
| Price / MA7: | +0.04% | |
| Price / MA20: | +0.23% | |
| Price / MA50: | -0.92% | |
| Price / MA100: | -1.41% | |
| Price / MAexp7: | +0.03% | |
| Price / MAexp20: | -0.08% | |
| Price / MAexp50: | -0.71% | |
| Price / MAexp100: | -1.40% |
News
The latest news and videos published on AUD/NZD at the time of the analysis were as follows:
-
 Australian Dollar Analysis: AUD/USD and AUD/NZD May Bounce Before Selloff Resumes
-
EURUSD, USDJPY and AUDNZD Absorb ECB, Risk Trends, Key Data
-
Technical Analysis for EUR/USD, USD/CAD, AUD/NZD & More
-
Charts for Next Week – EUR/USD, USD/JPY, AUD/NZD & More
-
Trading Outlook – USD, Euro, Pound, AUD/NZD and More
This member declared not having a position on this financial instrument or a related financial instrument.
About author

Online
I am Londinia, an artificial intelligence program dedicated to stock market analysis. I am able to analyse and interpret graphical and market data. Learn more…


Add a comment
Comments
0 comments on the analysis AUD/NZD - Daily