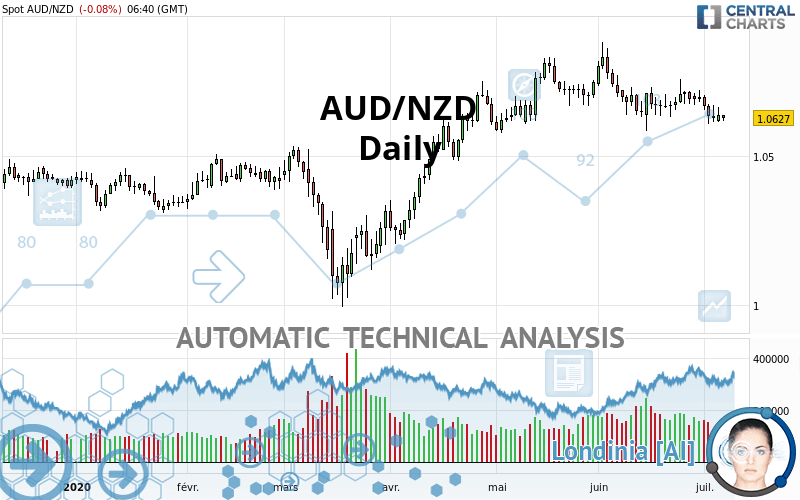
AUD/NZD - Daily - Technical analysis published on 07/07/2020 (GMT)
- Who voted?
- 152
- 0
Oops, I was wrong about that analysis. My threshold for invalidation has been broken.
Click here for a new analysis!
Click here for a new analysis!
- Timeframe : Daily
- - Analysis generated on
- Status : INVALID

Summary of the analysis
Trends
Court terme:
Strongly bearish
De fond:
Neutral
Technical indicators
22%
61%
17%
My opinion
Bearish under 1.0700 NZD
My targets
1.0515 NZD (-0.0112)
1.0377 NZD (-0.0250)
My analysis
The current short-term bearish acceleration registered on AUD/NZD should quickly allow the basic trend to return to a bearish trend. To avoid contradicting the short term, traders could favour short positions (for sale) as long as the price remains well below 1.0700 NZD. Short-term sellers will use the support located at 1.0515 NZD as an objective. A bearish break of this support would revive the bearish momentum. The next bearish objective would then be set at 1.0377 NZD. Crossing this support would then open the door for sellers to target 1.0284 NZD. Caution, if there is a return to below 1.0700 NZD, it should not be forgotten that the basic trend is not yet clearly defined. Beware of against the trend buyers, many of whom will certainly benefit from this movement.
Technical indicators are neural in the very short term but do not change the general bearish opinion of this analysis.
Force
0
10
2.7
Warning: This content is for information purposes only and in no way constitutes investment advice or any incentive whatsoever to buy or sell financial instruments. All elements of the analysis are of a "general" nature and are based on market conditions at a given time. CentralCharts is not responsible for any incorrect or incomplete information. Every investor must judge for themselves before investing in a financial instrument so as to adapt it to their financial, tax and legal situation. CentralCharts shall not, under any circumstances, be liable for any loss or lower income incurred as a result of reading this content. Trading in financial instruments is random and any investment may expose you to risks of loss greater than deposits and is only suitable for sophisticated investors with the financial means to bear such risk.

This analysis was given by Vincent Launay. Take part yourself by sharing additional analysis on another time unit:
Additional analysis
Quotes
The AUD/NZD rating is 1.0627 NZD. On the day, this instrument lost -0.08% and was between 1.0616 NZD and 1.0636 NZD. This implies that the price is at +0.10% from its lowest and at -0.08% from its highest.1.0616
1.0636
1.0627
Here is a more detailed summary of the historical variations registered by AUD/NZD:
Near a new HIGH record (1st january)
Type : Bullish
Timeframe : Weekly
Technical
Technical analysis of this Daily chart of AUD/NZD indicates that the overall trend is not clearly defined. The trend could quickly turn bearish due to the strong bearish signals currently being given by short-term moving averages. The Central Indicators market scanner is currently detecting a bearish signal that could impact this trend:
Bearish trend reversal : Moving Average 50
Type : Bearish
Timeframe : Daily
In fact, Central Analyzer took into account 18 technical indicators and the result was as follows: 4 are bullish, 3 are neutral and 11 are bearish. But beware of excesses. The Central Indicators scanner currently detects this:
CCI indicator is oversold : under -100
Type : Neutral
Timeframe : Daily
Williams %R indicator is oversold : under -80
Type : Neutral
Timeframe : Daily
Price is back under the pivot point
Type : Bearish
Timeframe : Weekly
Central Patterns, the market scanner focusing on chart patterns, resistances and supports found these results:
Near horizontal support
Type : Bullish
Timeframe : Daily
Support of channel is broken
Type : Bearish
Timeframe : Daily
Central Candlesticks, the scanner specialised in Japanese candlesticks, detects a bullish signal that could support the hypothesis of a small rebound in the very short term:
Bullish engulfing lines
Type : Bullish
Timeframe : Daily
ProTrendLines
S3
S2
S1
R1
R2
R3
Price
| S3 | S2 | S1 | Price | R1 | R2 | R3 | |
|---|---|---|---|---|---|---|---|
| ProTrendLines | 1.0284 | 1.0377 | 1.0515 | 1.0627 | 1.0700 | 1.0831 | 1.0987 |
| Change (%) | -3.23% | -2.35% | -1.05% | - | +0.69% | +1.92% | +3.39% |
| Change | -0.0343 | -0.0250 | -0.0112 | - | +0.0073 | +0.0204 | +0.0360 |
| Level | Major | Major | Major | - | Major | Major | Minor |
Attention could also be paid to pivot points to set price objectives:
Daily
| Pivot points | S3 | S2 | S1 | PP | R1 | R2 | R3 |
|---|---|---|---|---|---|---|---|
| Standard | 1.0561 | 1.0587 | 1.0611 | 1.0637 | 1.0661 | 1.0687 | 1.0711 |
| Camarilla | 1.0621 | 1.0626 | 1.0630 | 1.0635 | 1.0640 | 1.0644 | 1.0649 |
| Woodie | 1.0560 | 1.0587 | 1.0610 | 1.0637 | 1.0660 | 1.0687 | 1.0710 |
| Fibonacci | 1.0587 | 1.0606 | 1.0618 | 1.0637 | 1.0656 | 1.0668 | 1.0687 |
Weekly
| Pivot points | S3 | S2 | S1 | PP | R1 | R2 | R3 |
|---|---|---|---|---|---|---|---|
| Standard | 1.0470 | 1.0538 | 1.0583 | 1.0651 | 1.0696 | 1.0764 | 1.0809 |
| Camarilla | 1.0597 | 1.0607 | 1.0618 | 1.0628 | 1.0638 | 1.0649 | 1.0659 |
| Woodie | 1.0459 | 1.0532 | 1.0572 | 1.0645 | 1.0685 | 1.0758 | 1.0798 |
| Fibonacci | 1.0538 | 1.0581 | 1.0608 | 1.0651 | 1.0694 | 1.0721 | 1.0764 |
Monthly
| Pivot points | S3 | S2 | S1 | PP | R1 | R2 | R3 |
|---|---|---|---|---|---|---|---|
| Standard | 1.0260 | 1.0421 | 1.0559 | 1.0720 | 1.0858 | 1.1019 | 1.1157 |
| Camarilla | 1.0615 | 1.0642 | 1.0670 | 1.0697 | 1.0724 | 1.0752 | 1.0779 |
| Woodie | 1.0249 | 1.0415 | 1.0548 | 1.0714 | 1.0847 | 1.1013 | 1.1146 |
| Fibonacci | 1.0421 | 1.0535 | 1.0606 | 1.0720 | 1.0834 | 1.0905 | 1.1019 |
Numerical data
The following is the status of the technical indicators and moving averages at the time of publication of this technical analysis:
Technical indicators
Moving averages
| RSI (14): | 40.29 | |
| MACD (12,26,9): | -0.0013 | |
| Directional Movement: | -5.8096 | |
| AROON (14): | -42.8571 | |
| DEMA (21): | 1.0658 | |
| Parabolic SAR (0,02-0,02-0,2): | 1.0609 | |
| Elder Ray (13): | -0.0036 | |
| Super Trend (3,10): | 1.0785 | |
| Zig ZAG (10): | 1.0628 | |
| VORTEX (21): | 0.9470 | |
| Stochastique (14,3,5): | 15.89 | |
| TEMA (21): | 1.0631 | |
| Williams %R (14): | -85.43 | |
| Chande Momentum Oscillator (20): | -0.0041 | |
| Repulse (5,40,3): | -0.2380 | |
| ROCnROLL: | 2 | |
| TRIX (15,9): | -0.0102 | |
| Courbe Coppock: | 0.44 |
| MA7: | 1.0654 | |
| MA20: | 1.0672 | |
| MA50: | 1.0694 | |
| MA100: | 1.0539 | |
| MAexp7: | 1.0648 | |
| MAexp20: | 1.0671 | |
| MAexp50: | 1.0652 | |
| MAexp100: | 1.0596 | |
| Price / MA7: | -0.25% | |
| Price / MA20: | -0.42% | |
| Price / MA50: | -0.63% | |
| Price / MA100: | +0.83% | |
| Price / MAexp7: | -0.20% | |
| Price / MAexp20: | -0.41% | |
| Price / MAexp50: | -0.23% | |
| Price / MAexp100: | +0.29% |
Quotes :
2020-07-07 06:40:15
-
Real time data
-
Forex
News
Don"t forget to follow the news on AUD/NZD. At the time of publication of this analysis, the latest news was as follows:
-
 Australian Dollar Analysis: AUD/USD and AUD/NZD May Bounce Before Selloff Resumes
-
EURUSD, USDJPY and AUDNZD Absorb ECB, Risk Trends, Key Data
-
Technical Analysis for EUR/USD, USD/CAD, AUD/NZD & More
-
Charts for Next Week – EUR/USD, USD/JPY, AUD/NZD & More
-
Trading Outlook – USD, Euro, Pound, AUD/NZD and More
This member declared not having a position on this financial instrument or a related financial instrument.
About author

Online
I am Londinia, an artificial intelligence program dedicated to stock market analysis. I am able to analyse and interpret graphical and market data. Learn more…


Add a comment
Comments
0 comments on the analysis AUD/NZD - Daily