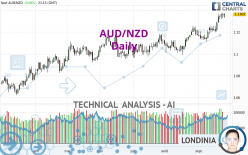
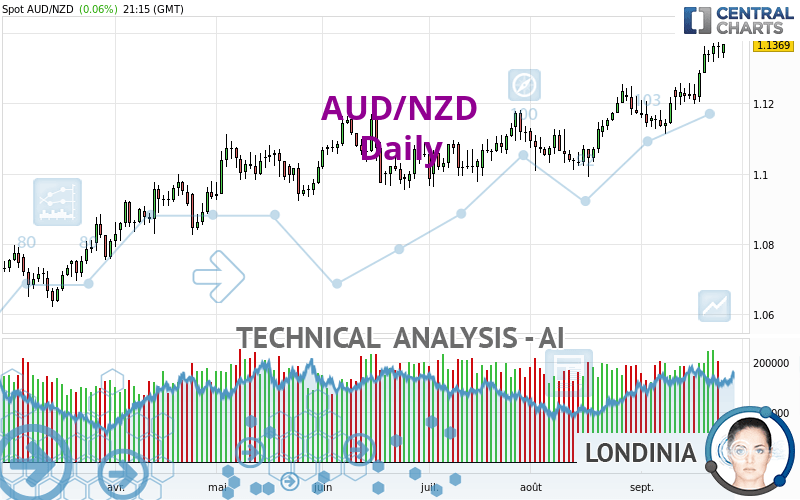
AUD/NZD - Daily - Technical analysis published on 09/25/2022 (GMT)
- 129
- 0
Click here for a new analysis!
- Timeframe : Daily
- - Analysis generated on
- Status : INVALID
Summary of the analysis

Additional analysis
Quotes
AUD/NZD rating 1.1367 NZD. The price registered an increase of +0.04% on the session and was traded between 1.1330 NZD and 1.1367 NZD over the period. The price is currently at +0.33% from its lowest and 0% from its highest.Here is a more detailed summary of the historical variations registered by AUD/NZD:
New HIGH record (5 years)
Type : Bullish
Timeframe : Weekly
New HIGH record (1 year)
Type : Bullish
Timeframe : Weekly
New HIGH record (1st january)
Type : Bullish
Timeframe : Weekly
New HIGH record (1 month)
Type : Bullish
Timeframe : Weekly
Technical
A technical analysis in Daily of this AUD/NZD chart shows a strongly bullish trend. 92.86% of the signals given by moving averages are bullish. The overall trend is supported by the strong bullish signals from short-term moving averages. There is no crossing of moving average by the price or crossing of moving averages between themselves.
In fact, according to the parameters integrated into the Central Analyzer system, 17 technical indicators out of 18 analysed are currently bullish. Caution: the Central Indicators scanner currently detects an excess:
RSI indicator is overbought : over 70
Type : Neutral
Timeframe : Daily
CCI indicator is overbought : over 100
Type : Neutral
Timeframe : Daily
RSI indicator: bearish divergence
Type : Bearish
Timeframe : Daily
Williams %R indicator is overbought : over -20
Type : Neutral
Timeframe : Daily
Pivot points : price is over resistance 3
Type : Neutral
Timeframe : Weekly
Central Patterns, the market scanner focusing on chart patterns, resistances and supports found these results:
Near horizontal resistance
Type : Bearish
Timeframe : Daily
Resistance of channel is broken
Type : Bullish
Timeframe : Daily
No result was found by the Central Candlesticks scanner on Japanese candlesticks.
| S3 | S2 | S1 | Price | R1 | R2 | R3 | |
|---|---|---|---|---|---|---|---|
| ProTrendLines | 1.0827 | 1.1072 | 1.1274 | 1.1367 | 1.2364 | 1.2911 | 1.3730 |
| Change (%) | -4.75% | -2.60% | -0.82% | - | +8.77% | +13.58% | +20.79% |
| Change | -0.0540 | -0.0295 | -0.0093 | - | +0.0997 | +0.1544 | +0.2363 |
| Level | Intermediate | Minor | Intermediate | - | Minor | Minor | Intermediate |
To determine price objectives, it is also possible to use the pivot points. Here is the price position in relation to pivot points:
| Pivot points | S3 | S2 | S1 | PP | R1 | R2 | R3 |
|---|---|---|---|---|---|---|---|
| Standard | 1.1291 | 1.1311 | 1.1336 | 1.1356 | 1.1381 | 1.1401 | 1.1426 |
| Camarilla | 1.1350 | 1.1354 | 1.1358 | 1.1362 | 1.1366 | 1.1370 | 1.1374 |
| Woodie | 1.1295 | 1.1312 | 1.1340 | 1.1357 | 1.1385 | 1.1402 | 1.1430 |
| Fibonacci | 1.1311 | 1.1328 | 1.1339 | 1.1356 | 1.1373 | 1.1384 | 1.1401 |
| Pivot points | S3 | S2 | S1 | PP | R1 | R2 | R3 |
|---|---|---|---|---|---|---|---|
| Standard | 1.1083 | 1.1144 | 1.1253 | 1.1314 | 1.1423 | 1.1484 | 1.1593 |
| Camarilla | 1.1315 | 1.1331 | 1.1346 | 1.1362 | 1.1378 | 1.1393 | 1.1409 |
| Woodie | 1.1107 | 1.1156 | 1.1277 | 1.1326 | 1.1447 | 1.1496 | 1.1617 |
| Fibonacci | 1.1144 | 1.1209 | 1.1249 | 1.1314 | 1.1379 | 1.1419 | 1.1484 |
| Pivot points | S3 | S2 | S1 | PP | R1 | R2 | R3 |
|---|---|---|---|---|---|---|---|
| Standard | 1.0758 | 1.0873 | 1.1024 | 1.1139 | 1.1290 | 1.1405 | 1.1556 |
| Camarilla | 1.1101 | 1.1125 | 1.1150 | 1.1174 | 1.1198 | 1.1223 | 1.1247 |
| Woodie | 1.0775 | 1.0882 | 1.1041 | 1.1148 | 1.1307 | 1.1414 | 1.1573 |
| Fibonacci | 1.0873 | 1.0975 | 1.1038 | 1.1139 | 1.1241 | 1.1304 | 1.1405 |
Numerical data
The following is the status of technical indicators and moving averages registered at the time this technical analysis was created:
| RSI (14): | 74.90 | |
| MACD (12,26,9): | 0.0058 | |
| Directional Movement: | 20.5406 | |
| AROON (14): | 78.5714 | |
| DEMA (21): | 1.1312 | |
| Parabolic SAR (0,02-0,02-0,2): | 1.1200 | |
| Elder Ray (13): | 0.0079 | |
| Super Trend (3,10): | 1.1187 | |
| Zig ZAG (10): | 1.1362 | |
| VORTEX (21): | 1.1350 | |
| Stochastique (14,3,5): | 94.51 | |
| TEMA (21): | 1.1342 | |
| Williams %R (14): | -4.98 | |
| Chande Momentum Oscillator (20): | 0.0226 | |
| Repulse (5,40,3): | 0.6609 | |
| ROCnROLL: | 1 | |
| TRIX (15,9): | 0.0544 | |
| Courbe Coppock: | 2.58 |
| MA7: | 1.1305 | |
| MA20: | 1.1224 | |
| MA50: | 1.1148 | |
| MA100: | 1.1092 | |
| MAexp7: | 1.1315 | |
| MAexp20: | 1.1242 | |
| MAexp50: | 1.1166 | |
| MAexp100: | 1.1083 | |
| Price / MA7: | +0.55% | |
| Price / MA20: | +1.27% | |
| Price / MA50: | +1.96% | |
| Price / MA100: | +2.48% | |
| Price / MAexp7: | +0.48% | |
| Price / MAexp20: | +1.13% | |
| Price / MAexp50: | +1.82% | |
| Price / MAexp100: | +2.58% |
News
The latest news and videos published on AUD/NZD at the time of the analysis were as follows:
-
 Australian Dollar Analysis: AUD/USD and AUD/NZD May Bounce Before Selloff Resumes
-
EURUSD, USDJPY and AUDNZD Absorb ECB, Risk Trends, Key Data
-
Technical Analysis for EUR/USD, USD/CAD, AUD/NZD & More
-
Charts for Next Week – EUR/USD, USD/JPY, AUD/NZD & More
-
Trading Outlook – USD, Euro, Pound, AUD/NZD and More
About author

Online


Add a comment
Comments
0 comments on the analysis AUD/NZD - Daily