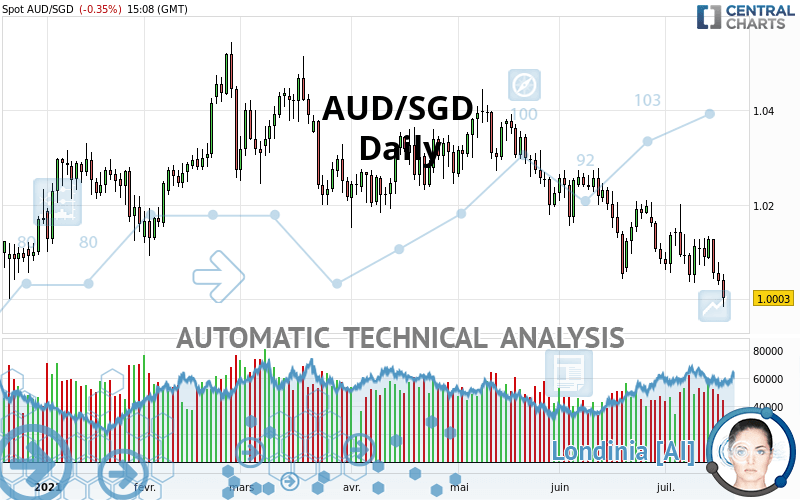
AUD/SGD - Daily - Technical analysis published on 07/19/2021 (GMT)
- 215
- 0
Click here for a new analysis!
- Timeframe : Daily
- - Analysis generated on
- Status : LEVEL MAINTAINED

Summary of the analysis

Additional analysis
Quotes
AUD/SGD rating 1.0003 SGD. The price is lower by -0.35% since the last closing with the lowest point at 0.9984 SGD and the highest point at 1.0053 SGD. The deviation from the price is +0.19% for the low point and -0.50% for the high point.The Central Gaps scanner detects a bullish opening marking the presence of buyers ahead of sellers at the opening but not sufficiently marked to allow the price to register a quotation gap.
Bullish opening
Type : Bullish
Timeframe : Openning
Here is a more detailed summary of the historical variations registered by AUD/SGD:
Near a new HIGH record (1st january)
Type : Bullish
Timeframe : Weekly
Near a new HIGH record (1 month)
Type : Bullish
Timeframe : Weekly
Technical
A technical analysis in Daily of this AUD/SGD chart shows a sharp bearish trend. The signals given by moving averages are 92.86% bearish. This strong bearish trend is confirmed by the strong signals currently being given by short-term moving averages. The Central Indicators scanner does not detect any result on moving averages that would impact this trend.
On the 18 technical indicators analysed, 4 are bullish, 2 are neutral and 12 are bearish. Caution: the Central Indicators scanner currently detects an excess:
CCI indicator is oversold : under -100
Type : Neutral
Timeframe : Daily
Williams %R indicator is oversold : under -80
Type : Neutral
Timeframe : Daily
Pivot points : price is under support 1
Type : Neutral
Timeframe : Weekly
Pivot points : price is under support 3
Type : Neutral
Timeframe : Daily
MACD crosses DOWN its Moving Average
Type : Bearish
Timeframe : Daily
An analysis of the price chart with the Central Patterns scanner (detector of chart patterns and resistances and supports) shows several results that can have an impact on the price change:
Horizontal support is broken
Type : Bearish
Timeframe : Daily
Support of channel is broken
Type : Bearish
Timeframe : Daily
Support of triangle is broken
Type : Bearish
Timeframe : Daily
The Central Candlesticks scanner, specialised in Japanese candlesticks, did not identify any signals.
| S3 | S2 | S1 | Price | R1 | R2 | R3 | |
|---|---|---|---|---|---|---|---|
| ProTrendLines | 0.9565 | 0.9772 | 0.9845 | 1.0003 | 1.0053 | 1.0211 | 1.0299 |
| Change (%) | -4.38% | -2.31% | -1.58% | - | +0.50% | +2.08% | +2.96% |
| Change | -0.0438 | -0.0231 | -0.0158 | - | +0.0050 | +0.0208 | +0.0296 |
| Level | Minor | Minor | Major | - | Major | Major | Intermediate |
Attention could also be paid to pivot points to set price objectives:
| Pivot points | S3 | S2 | S1 | PP | R1 | R2 | R3 |
|---|---|---|---|---|---|---|---|
| Standard | 0.9970 | 1.0000 | 1.0019 | 1.0049 | 1.0068 | 1.0098 | 1.0117 |
| Camarilla | 1.0025 | 1.0029 | 1.0034 | 1.0038 | 1.0043 | 1.0047 | 1.0052 |
| Woodie | 0.9965 | 0.9997 | 1.0014 | 1.0046 | 1.0063 | 1.0095 | 1.0112 |
| Fibonacci | 1.0000 | 1.0019 | 1.0030 | 1.0049 | 1.0068 | 1.0079 | 1.0098 |
| Pivot points | S3 | S2 | S1 | PP | R1 | R2 | R3 |
|---|---|---|---|---|---|---|---|
| Standard | 0.9897 | 0.9963 | 1.0001 | 1.0067 | 1.0105 | 1.0171 | 1.0209 |
| Camarilla | 1.0009 | 1.0019 | 1.0029 | 1.0038 | 1.0048 | 1.0057 | 1.0067 |
| Woodie | 0.9882 | 0.9956 | 0.9986 | 1.0060 | 1.0090 | 1.0164 | 1.0194 |
| Fibonacci | 0.9963 | 1.0003 | 1.0028 | 1.0067 | 1.0107 | 1.0132 | 1.0171 |
| Pivot points | S3 | S2 | S1 | PP | R1 | R2 | R3 |
|---|---|---|---|---|---|---|---|
| Standard | 0.9756 | 0.9900 | 0.9992 | 1.0136 | 1.0228 | 1.0372 | 1.0464 |
| Camarilla | 1.0020 | 1.0042 | 1.0063 | 1.0085 | 1.0107 | 1.0128 | 1.0150 |
| Woodie | 0.9731 | 0.9887 | 0.9967 | 1.0123 | 1.0203 | 1.0359 | 1.0439 |
| Fibonacci | 0.9900 | 0.9990 | 1.0046 | 1.0136 | 1.0226 | 1.0282 | 1.0372 |
Numerical data
The following are the details of the technical indicators and moving averages that were collected to generate this technical analysis:
| RSI (14): | 35.71 | |
| MACD (12,26,9): | -0.0041 | |
| Directional Movement: | -12.9908 | |
| AROON (14): | -64.2857 | |
| DEMA (21): | 1.0050 | |
| Parabolic SAR (0,02-0,02-0,2): | 1.0144 | |
| Elder Ray (13): | -0.0065 | |
| Super Trend (3,10): | 1.0210 | |
| Zig ZAG (10): | 1.0000 | |
| VORTEX (21): | 0.9501 | |
| Stochastique (14,3,5): | 7.85 | |
| TEMA (21): | 1.0042 | |
| Williams %R (14): | -92.69 | |
| Chande Momentum Oscillator (20): | -0.0077 | |
| Repulse (5,40,3): | -0.9943 | |
| ROCnROLL: | 2 | |
| TRIX (15,9): | -0.0530 | |
| Courbe Coppock: | 1.46 |
| MA7: | 1.0077 | |
| MA20: | 1.0110 | |
| MA50: | 1.0197 | |
| MA100: | 1.0257 | |
| MAexp7: | 1.0062 | |
| MAexp20: | 1.0104 | |
| MAexp50: | 1.0169 | |
| MAexp100: | 1.0196 | |
| Price / MA7: | -0.73% | |
| Price / MA20: | -1.06% | |
| Price / MA50: | -1.90% | |
| Price / MA100: | -2.48% | |
| Price / MAexp7: | -0.59% | |
| Price / MAexp20: | -1.00% | |
| Price / MAexp50: | -1.63% | |
| Price / MAexp100: | -1.89% |
About author

Online


Add a comment
Comments
0 comments on the analysis AUD/SGD - Daily