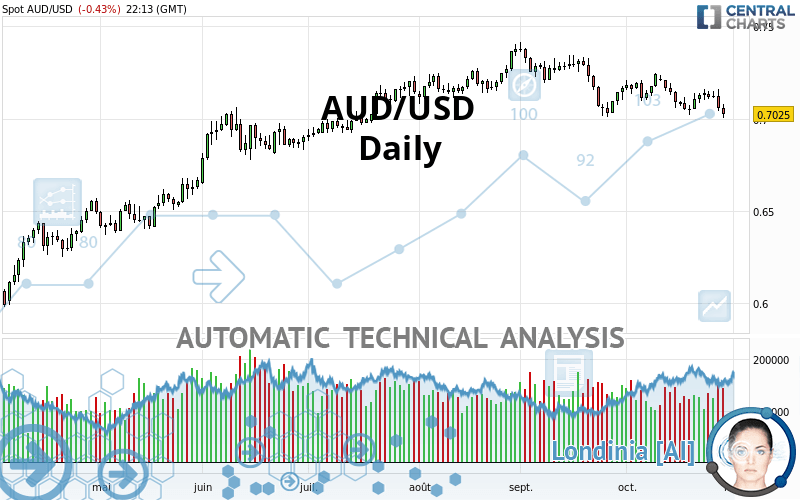
AUD/USD - Daily - Technical analysis published on 10/29/2020 (GMT)
- 182
- 0
Click here for a new analysis!
- Timeframe : Daily
- - Analysis generated on
- Status : INVALID

Summary of the analysis

Additional analysis
Quotes
The AUD/USD rating is 0.7025 USD. On the day, this instrument lost -0.43% and was between 0.7002 USD and 0.7076 USD. This implies that the price is at +0.33% from its lowest and at -0.72% from its highest.So that you have an overall view of the price change, here is a table showing the variations over several periods:
Near a new HIGH record (1st january)
Type : Bullish
Timeframe : Weekly
Near a new HIGH record (1 month)
Type : Bullish
Timeframe : Weekly
Technical
Technical analysis of AUD/USD in Daily shows an overall bearish trend. The signals given by moving averages are 67.86% bearish. This bearish trend is reinforced by the strong signals currently being given by short-term moving averages. The Central Indicators scanner detects bearish signals on moving averages that could impact this trend:
Bearish trend reversal : adaptative moving average 100
Type : Bearish
Timeframe : Daily
Bearish price crossover with Moving Average 100
Type : Bearish
Timeframe : Daily
An assessment of technical indicators does not currently provide any relevant information on the direction of future price movements.
Caution: the Central Indicators scanner currently detects an excess:
MACD indicator: bearish divergence
Type : Bearish
Timeframe : Daily
Williams %R indicator is oversold : under -80
Type : Neutral
Timeframe : Daily
Pivot points : price is under support 1
Type : Neutral
Timeframe : Weekly
MACD crosses DOWN its Moving Average
Type : Bearish
Timeframe : Daily
Price is back over the pivot point
Type : Bullish
Timeframe : Weekly
Price is back under the pivot point
Type : Bearish
Timeframe : Daily
Central Patterns, the market scanner focusing on chart patterns, resistances and supports found these results:
Horizontal support is broken
Type : Bearish
Timeframe : Daily
Support of channel is broken
Type : Bearish
Timeframe : Daily
The Central Candlesticks scanner which studies Japanese candlesticks did not detect anything.
| S3 | S2 | S1 | Price | R1 | R2 | R3 | |
|---|---|---|---|---|---|---|---|
| ProTrendLines | 0.6297 | 0.6551 | 0.6870 | 0.7025 | 0.7059 | 0.7244 | 0.7370 |
| Change (%) | -10.36% | -6.75% | -2.21% | - | +0.48% | +3.12% | +4.91% |
| Change | -0.0728 | -0.0474 | -0.0155 | - | +0.0034 | +0.0219 | +0.0345 |
| Level | Minor | Minor | Major | - | Major | Intermediate | Major |
Attention could also be paid to pivot points to set price objectives:
| Pivot points | S3 | S2 | S1 | PP | R1 | R2 | R3 |
|---|---|---|---|---|---|---|---|
| Standard | 0.6889 | 0.6964 | 0.7009 | 0.7084 | 0.7129 | 0.7204 | 0.7249 |
| Camarilla | 0.7022 | 0.7033 | 0.7044 | 0.7055 | 0.7066 | 0.7077 | 0.7088 |
| Woodie | 0.6875 | 0.6957 | 0.6995 | 0.7077 | 0.7115 | 0.7197 | 0.7235 |
| Fibonacci | 0.6964 | 0.7010 | 0.7038 | 0.7084 | 0.7130 | 0.7158 | 0.7204 |
| Pivot points | S3 | S2 | S1 | PP | R1 | R2 | R3 |
|---|---|---|---|---|---|---|---|
| Standard | 0.6914 | 0.6967 | 0.7052 | 0.7105 | 0.7190 | 0.7243 | 0.7328 |
| Camarilla | 0.7099 | 0.7112 | 0.7124 | 0.7137 | 0.7150 | 0.7162 | 0.7175 |
| Woodie | 0.6930 | 0.6975 | 0.7068 | 0.7113 | 0.7206 | 0.7251 | 0.7344 |
| Fibonacci | 0.6967 | 0.7020 | 0.7052 | 0.7105 | 0.7158 | 0.7190 | 0.7243 |
| Pivot points | S3 | S2 | S1 | PP | R1 | R2 | R3 |
|---|---|---|---|---|---|---|---|
| Standard | 0.6568 | 0.6787 | 0.6976 | 0.7195 | 0.7384 | 0.7603 | 0.7792 |
| Camarilla | 0.7053 | 0.7090 | 0.7128 | 0.7165 | 0.7202 | 0.7240 | 0.7277 |
| Woodie | 0.6553 | 0.6780 | 0.6961 | 0.7188 | 0.7369 | 0.7596 | 0.7777 |
| Fibonacci | 0.6787 | 0.6943 | 0.7039 | 0.7195 | 0.7351 | 0.7447 | 0.7603 |
Numerical data
The following is the status of the technical indicators and moving averages at the time of publication of this technical analysis:
| RSI (14): | 37.60 | |
| MACD (12,26,9): | -0.0029 | |
| Directional Movement: | -15.3763 | |
| AROON (14): | -100.0000 | |
| DEMA (21): | 0.7079 | |
| Parabolic SAR (0,02-0,02-0,2): | 0.7185 | |
| Elder Ray (13): | -0.0062 | |
| Super Trend (3,10): | 0.7237 | |
| Zig ZAG (10): | 0.7029 | |
| VORTEX (21): | 0.9223 | |
| Stochastique (14,3,5): | 24.51 | |
| TEMA (21): | 0.7064 | |
| Williams %R (14): | -88.51 | |
| Chande Momentum Oscillator (20): | -0.0135 | |
| Repulse (5,40,3): | -1.4620 | |
| ROCnROLL: | 2 | |
| TRIX (15,9): | -0.0532 | |
| Courbe Coppock: | 2.35 |
| MA7: | 0.7099 | |
| MA20: | 0.7124 | |
| MA50: | 0.7189 | |
| MA100: | 0.7113 | |
| MAexp7: | 0.7084 | |
| MAexp20: | 0.7116 | |
| MAexp50: | 0.7136 | |
| MAexp100: | 0.7066 | |
| Price / MA7: | -1.04% | |
| Price / MA20: | -1.39% | |
| Price / MA50: | -2.28% | |
| Price / MA100: | -1.24% | |
| Price / MAexp7: | -0.83% | |
| Price / MAexp20: | -1.28% | |
| Price / MAexp50: | -1.56% | |
| Price / MAexp100: | -0.58% |
News
The last news published on AUD/USD at the time of the generation of this analysis was as follows:
-
 USD/JPY and AUD/USD Forecast October 30, 2020
-
AUD/USD Technical Analysis for October 30, 2020 by FXEmpire
-
AUD/USD Technical Analysis For October 29, 2020 By FX Empire
-
USD/JPY and AUD/USD Forecast October 29, 2020
-
AUD/USD Technical Analysis for October 29, 2020 by FXEmpire
About author

Online


Add a comment
Comments
0 comments on the analysis AUD/USD - Daily