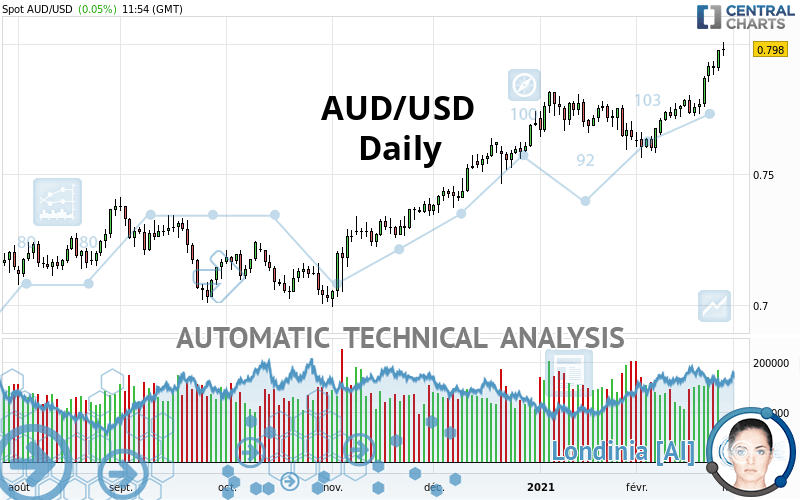
AUD/USD - Daily - Technical analysis published on 02/25/2021 (GMT)
- 204
- 0
Click here for a new analysis!
- Timeframe : Daily
- - Analysis generated on
- Status : INVALID

Summary of the analysis

Additional analysis
Quotes
AUD/USD rating 0.7980 USD. On the day, this instrument gained +0.05% and was between 0.7952 USD and 0.8007 USD. This implies that the price is at +0.35% from its lowest and at -0.34% from its highest.So that you have an overall view of the price change, here is a table showing the variations over several periods:
Near a new HIGH record (5 years)
Type : Bullish
Timeframe : Weekly
New HIGH record (1 year)
Type : Bullish
Timeframe : Weekly
New HIGH record (1st january)
Type : Bullish
Timeframe : Weekly
Near a new LOW record (1st january)
Type : Bearish
Timeframe : Weekly
New HIGH record (1 month)
Type : Bullish
Timeframe : Weekly
Near a new LOW record (1 month)
Type : Bearish
Timeframe : Weekly
Technical
A technical analysis in Daily of this AUD/USD chart shows a strongly bullish trend. 92.86% of the signals given by moving averages are bullish. This strongly bullish trend is supported by the strong bullish signals given by short-term moving averages. The Central Indicators scanner does not detect any result on moving averages that would impact this trend.
In fact, 16 technical indicators on 18 studied are currently positioned bullish. Caution: the Central Indicators scanner currently detects an excess:
RSI indicator is overbought : over 70
Type : Neutral
Timeframe : Daily
CCI indicator is overbought : over 100
Type : Neutral
Timeframe : Daily
Williams %R indicator is overbought : over -20
Type : Neutral
Timeframe : Daily
Pivot points : price is over resistance 2
Type : Neutral
Timeframe : Weekly
Price is back over the pivot point
Type : Bullish
Timeframe : Daily
Central Patterns, the market scanner focusing on chart patterns, resistances and supports found these results:
Near horizontal resistance
Type : Bearish
Timeframe : Daily
Resistance of channel is broken
Type : Bullish
Timeframe : Daily
Resistance of triangle is broken
Type : Bullish
Timeframe : Daily
The Central Candlesticks scanner, specialised in Japanese candlesticks, did not identify any signals.
| S3 | S2 | S1 | Price | R1 | R2 | R3 | |
|---|---|---|---|---|---|---|---|
| ProTrendLines | 0.7364 | 0.7601 | 0.7819 | 0.7980 | 0.8110 | 0.8683 | 0.9806 |
| Change (%) | -7.72% | -4.75% | -2.02% | - | +1.63% | +8.81% | +22.88% |
| Change | -0.0616 | -0.0379 | -0.0161 | - | +0.0130 | +0.0703 | +0.1826 |
| Level | Major | Minor | Major | - | Major | Minor | Intermediate |
Attention could also be paid to pivot points to set price objectives:
| Pivot points | S3 | S2 | S1 | PP | R1 | R2 | R3 |
|---|---|---|---|---|---|---|---|
| Standard | 0.7838 | 0.7867 | 0.7921 | 0.7950 | 0.8004 | 0.8033 | 0.8087 |
| Camarilla | 0.7953 | 0.7961 | 0.7968 | 0.7976 | 0.7984 | 0.7991 | 0.7999 |
| Woodie | 0.7852 | 0.7873 | 0.7935 | 0.7956 | 0.8018 | 0.8039 | 0.8101 |
| Fibonacci | 0.7867 | 0.7898 | 0.7918 | 0.7950 | 0.7981 | 0.8001 | 0.8033 |
| Pivot points | S3 | S2 | S1 | PP | R1 | R2 | R3 |
|---|---|---|---|---|---|---|---|
| Standard | 0.7616 | 0.7670 | 0.7769 | 0.7823 | 0.7922 | 0.7976 | 0.8075 |
| Camarilla | 0.7826 | 0.7840 | 0.7854 | 0.7868 | 0.7882 | 0.7896 | 0.7910 |
| Woodie | 0.7639 | 0.7681 | 0.7792 | 0.7834 | 0.7945 | 0.7987 | 0.8098 |
| Fibonacci | 0.7670 | 0.7728 | 0.7765 | 0.7823 | 0.7881 | 0.7918 | 0.7976 |
| Pivot points | S3 | S2 | S1 | PP | R1 | R2 | R3 |
|---|---|---|---|---|---|---|---|
| Standard | 0.7323 | 0.7457 | 0.7551 | 0.7685 | 0.7779 | 0.7913 | 0.8007 |
| Camarilla | 0.7581 | 0.7602 | 0.7623 | 0.7644 | 0.7665 | 0.7686 | 0.7707 |
| Woodie | 0.7302 | 0.7447 | 0.7530 | 0.7675 | 0.7758 | 0.7903 | 0.7986 |
| Fibonacci | 0.7457 | 0.7544 | 0.7598 | 0.7685 | 0.7772 | 0.7826 | 0.7913 |
Numerical data
The following are the details of the technical indicators and moving averages that were collected to generate this technical analysis:
| RSI (14): | 73.08 | |
| MACD (12,26,9): | 0.0071 | |
| Directional Movement: | 20.7901 | |
| AROON (14): | 100.0000 | |
| DEMA (21): | 0.7886 | |
| Parabolic SAR (0,02-0,02-0,2): | 0.7821 | |
| Elder Ray (13): | 0.0138 | |
| Super Trend (3,10): | 0.7779 | |
| Zig ZAG (10): | 0.7979 | |
| VORTEX (21): | 1.2254 | |
| Stochastique (14,3,5): | 94.56 | |
| TEMA (21): | 0.7918 | |
| Williams %R (14): | -7.30 | |
| Chande Momentum Oscillator (20): | 0.0241 | |
| Repulse (5,40,3): | 1.4506 | |
| ROCnROLL: | 1 | |
| TRIX (15,9): | 0.0775 | |
| Courbe Coppock: | 5.93 |
| MA7: | 0.7882 | |
| MA20: | 0.7759 | |
| MA50: | 0.7715 | |
| MA100: | 0.7488 | |
| MAexp7: | 0.7900 | |
| MAexp20: | 0.7803 | |
| MAexp50: | 0.7694 | |
| MAexp100: | 0.7539 | |
| Price / MA7: | +1.24% | |
| Price / MA20: | +2.85% | |
| Price / MA50: | +3.43% | |
| Price / MA100: | +6.57% | |
| Price / MAexp7: | +1.01% | |
| Price / MAexp20: | +2.27% | |
| Price / MAexp50: | +3.72% | |
| Price / MAexp100: | +5.85% |
News
The last news published on AUD/USD at the time of the generation of this analysis was as follows:
-
 AUD/USD Daily Forecast - Resistance At 0.8000 In Sight
-
AUD/USD Technical Analysis for February 25, 2021 by FXEmpire
-
AUD/USD Daily Forecast - Australian Dollar Remains Strong
-
AUD/USD Technical Analysis for February 24, 2021 by FXEmpire
-
AUD/USD Daily Forecast - Test Of Resistance At 0.7910
About author

Online


Add a comment
Comments
0 comments on the analysis AUD/USD - Daily