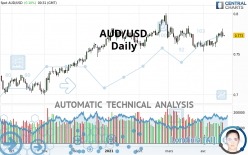
AUD/USD - Daily - Technical analysis published on 04/21/2021 (GMT)
- 182
- 0
Click here for a new analysis!
- Timeframe : Daily
- - Analysis generated on
- Status : TARGET REACHED
Summary of the analysis

Additional analysis
Quotes
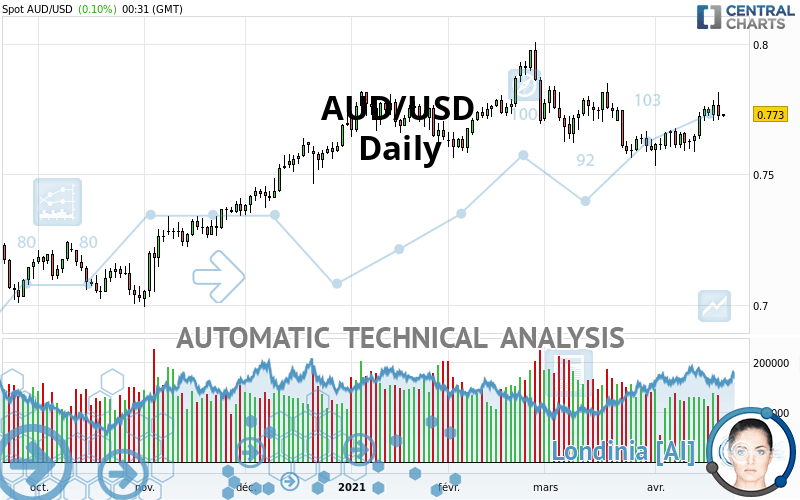
The AUD/USD price is 0.7731 USD. The price has increased by +0.12% since the last closing with the lowest point at 0.7720 USD and the highest point at 0.7732 USD. The deviation from the price is +0.14% for the low point and -0.01% for the high point.Here is a more detailed summary of the historical variations registered by AUD/USD:
Near a new HIGH record (5 years)
Type : Bullish
Timeframe : Weekly
Technical
A technical analysis in Daily of this AUD/USD chart shows a strongly bullish trend. 85.71% of the signals given by moving averages are bullish. The overall trend is supported by the strong bullish signals from short-term moving averages. An assessment of moving averages reveals several bearish signals that could impact this trend:
Bearish price crossover with Moving Average 50
Type : Bearish
Timeframe : Daily
Bearish price crossover with adaptative moving average 50
Type : Bearish
Timeframe : Daily
In fact, according to the parameters integrated into the Central Analyzer system, 13 technical indicators out of 18 analysed are currently bullish. Caution: the Central Indicators scanner currently detects an excess:
CCI indicator is overbought : over 100
Type : Neutral
Timeframe : Daily
Previous candle closed over Bollinger bands
Type : Neutral
Timeframe : Daily
RSI indicator: bearish divergence
Type : Bearish
Timeframe : Daily
Ichimoku : price is under the cloud
Type : Bearish
Timeframe : Daily
Ichimoku - Bullish crossover : Tenkan & Kijun
Type : Bullish
Timeframe : Daily
Price is back over the pivot point
Type : Bullish
Timeframe : Weekly
Price is back under the pivot point
Type : Bearish
Timeframe : Daily
Central Patterns, the market scanner focusing on chart patterns, resistances and supports found these results:
Resistance of channel is broken
Type : Bullish
Timeframe : Daily
Horizontal support is broken
Type : Bearish
Timeframe : Daily
The presence of a bearish pattern in Japanese candlesticks detected by Central Candlesticks that could cause a correction in the very short term was also detected:
Bearish engulfing lines
Type : Bearish
Timeframe : Daily
| S3 | S2 | S1 | Price | R1 | R2 | R3 | |
|---|---|---|---|---|---|---|---|
| ProTrendLines | 0.7246 | 0.7364 | 0.7596 | 0.7731 | 0.7735 | 0.7815 | 0.7976 |
| Change (%) | -6.27% | -4.75% | -1.75% | - | +0.05% | +1.09% | +3.17% |
| Change | -0.0485 | -0.0367 | -0.0135 | - | +0.0004 | +0.0084 | +0.0245 |
| Level | Minor | Major | Major | - | Minor | Major | Minor |
Pivot points can also be used to set your price objectives. Here is the price situation in relation to pivot points:
| Pivot points | S3 | S2 | S1 | PP | R1 | R2 | R3 |
|---|---|---|---|---|---|---|---|
| Standard | 0.7575 | 0.7642 | 0.7682 | 0.7749 | 0.7789 | 0.7856 | 0.7896 |
| Camarilla | 0.7693 | 0.7702 | 0.7712 | 0.7722 | 0.7732 | 0.7742 | 0.7751 |
| Woodie | 0.7562 | 0.7635 | 0.7669 | 0.7742 | 0.7776 | 0.7849 | 0.7883 |
| Fibonacci | 0.7642 | 0.7683 | 0.7708 | 0.7749 | 0.7790 | 0.7815 | 0.7856 |
| Pivot points | S3 | S2 | S1 | PP | R1 | R2 | R3 |
|---|---|---|---|---|---|---|---|
| Standard | 0.7449 | 0.7518 | 0.7625 | 0.7694 | 0.7801 | 0.7870 | 0.7977 |
| Camarilla | 0.7685 | 0.7701 | 0.7717 | 0.7733 | 0.7749 | 0.7765 | 0.7781 |
| Woodie | 0.7469 | 0.7528 | 0.7645 | 0.7704 | 0.7821 | 0.7880 | 0.7997 |
| Fibonacci | 0.7518 | 0.7585 | 0.7626 | 0.7694 | 0.7761 | 0.7802 | 0.7870 |
| Pivot points | S3 | S2 | S1 | PP | R1 | R2 | R3 |
|---|---|---|---|---|---|---|---|
| Standard | 0.7201 | 0.7382 | 0.7488 | 0.7669 | 0.7775 | 0.7956 | 0.8062 |
| Camarilla | 0.7515 | 0.7541 | 0.7568 | 0.7594 | 0.7620 | 0.7647 | 0.7673 |
| Woodie | 0.7164 | 0.7363 | 0.7451 | 0.7650 | 0.7738 | 0.7937 | 0.8025 |
| Fibonacci | 0.7382 | 0.7492 | 0.7559 | 0.7669 | 0.7779 | 0.7846 | 0.7956 |
Numerical data
The following are the details of the technical indicators and moving averages that were collected to generate this technical analysis:
| RSI (14): | 54.26 | |
| MACD (12,26,9): | 0.0010 | |
| Directional Movement: | 11.3636 | |
| AROON (14): | 92.8571 | |
| DEMA (21): | 0.7696 | |
| Parabolic SAR (0,02-0,02-0,2): | 0.7588 | |
| Elder Ray (13): | 0.0027 | |
| Super Trend (3,10): | 0.7798 | |
| Zig ZAG (10): | 0.7727 | |
| VORTEX (21): | 1.0932 | |
| Stochastique (14,3,5): | 73.59 | |
| TEMA (21): | 0.7718 | |
| Williams %R (14): | -37.83 | |
| Chande Momentum Oscillator (20): | 0.0072 | |
| Repulse (5,40,3): | -0.0238 | |
| ROCnROLL: | 1 | |
| TRIX (15,9): | -0.0165 | |
| Courbe Coppock: | 2.48 |
| MA7: | 0.7725 | |
| MA20: | 0.7661 | |
| MA50: | 0.7723 | |
| MA100: | 0.7678 | |
| MAexp7: | 0.7717 | |
| MAexp20: | 0.7692 | |
| MAexp50: | 0.7687 | |
| MAexp100: | 0.7620 | |
| Price / MA7: | +0.08% | |
| Price / MA20: | +0.91% | |
| Price / MA50: | +0.10% | |
| Price / MA100: | +0.69% | |
| Price / MAexp7: | +0.17% | |
| Price / MAexp20: | +0.49% | |
| Price / MAexp50: | +0.56% | |
| Price / MAexp100: | +1.44% |
News
The last news published on AUD/USD at the time of the generation of this analysis was as follows:
-
 AUD/USD Technical Analysis for April 21, 2021 by FXEmpire
-
AUD/USD Daily Forecast - Test Of Resistance At 0.7800
-
AUD/USD Technical Analysis for April 20, 2021 by FXEmpire
-
AUD/USD Daily Forecast - U.S. Dollar Is Under Pressure At The Start Of The Week
-
AUD/USD Technical Analysis for the Week of April 19, 2021 by FXEmpire
About author

Online


Add a comment
Comments
0 comments on the analysis AUD/USD - Daily