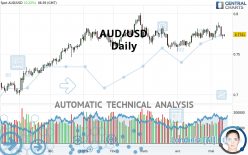
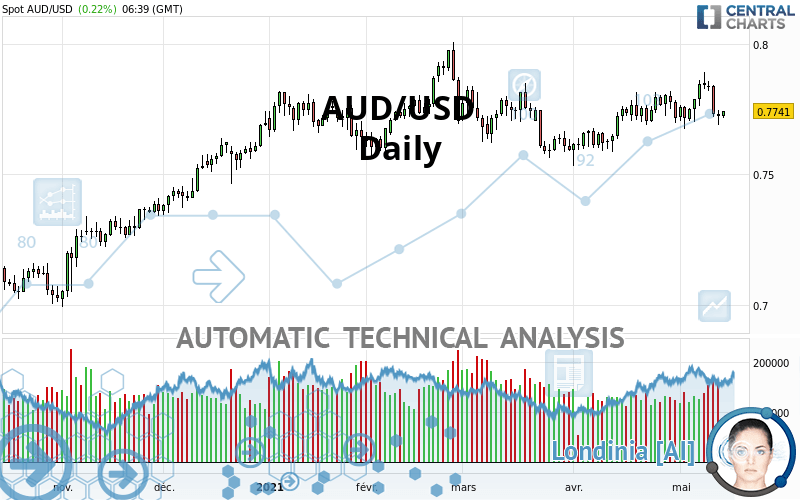
AUD/USD - Daily - Technical analysis published on 05/14/2021 (GMT)
- 201
- 0
I am delighted to see that my first price objective has been achieved. I hope you've taken advantage of it.
Click here for a new analysis!
Click here for a new analysis!
- Timeframe : Daily
- - Analysis generated on
- Status : TARGET REACHED
Summary of the analysis
Trends
Short term:
Neutral
Underlying:
Bullish
Technical indicators
17%
50%
33%
My opinion
Bullish above 0.7596 USD
My targets
0.7810 USD (+0.0070)
0.7976 USD (+0.0236)
My analysis
Has the basic bullish trend slowed or is it lacking in power? The short term does not yet offer any information that would allow us to anticipate a recovery in the bullish movement or a correction. Sellers' generally have the upper hand, even if a small correction (not tradeable) on the support located at 0.7596 USD remains possible. It is advisable to trade AUD/USD with the greatest caution, while favouring long positions (at the time of purchase) as long as the price remains well above 0.7596 USD. The next bullish objective for buyers is set at 0.7810 USD. A bullish break in this resistance would boost the bullish momentum. The buyers could then target the resistance located at 0.7976 USD. If there is any crossing, the next objective would be the resistance located at 0.8110 USD. PS: if there is a bearish break in the support located at 0.7596 USD we suggest that you produce a new automated technical analysis. In fact, conditions should have changed. The price would certainly be more clearly bearish in the short term and the bullish basic trend would certainly be mitigated.
In the very short term, the general bullish opinion of this analysis is in opposition with technical indicators. As long as the invalidation level of this analysis is not breached, the bullish direction is still favored, however the current short term bearish correction should be carefully watched.
Force
0
10
1.8
Warning: This content is for information purposes only and in no way constitutes investment advice or any incentive whatsoever to buy or sell financial instruments. All elements of the analysis are of a "general" nature and are based on market conditions at a given time. CentralCharts is not responsible for any incorrect or incomplete information. Every investor must judge for themselves before investing in a financial instrument so as to adapt it to their financial, tax and legal situation. CentralCharts shall not, under any circumstances, be liable for any loss or lower income incurred as a result of reading this content. Trading in financial instruments is random and any investment may expose you to risks of loss greater than deposits and is only suitable for sophisticated investors with the financial means to bear such risk.

This analysis was given by Vincent Launay. Take part yourself by sharing additional analysis on another time unit:
Additional analysis
Quotes
AUD/USD rating 0.7740 USD. On the day, this instrument gained +0.21% with the lowest point at 0.7714 USD and the highest point at 0.7743 USD. The deviation from the price is +0.34% for the low point and -0.04% for the high point.0.7714
0.7743
0.7740
Here is a more detailed summary of the historical variations registered by AUD/USD:
Near a new HIGH record (5 years)
Type : Bullish
Timeframe : Weekly
Technical
Technical analysis of this Daily chart of AUD/USD indicates that the overall trend is bullish. The signals given by moving averages are 71.43% bullish. This bullish trend could slow down given the neutral signals currently being given by short-term moving averages. The Central Indicators market scanner is currently detecting a bearish signal that could impact this trend:
Bearish price crossover with adaptative moving average 50
Type : Bearish
Timeframe : Daily
Technical indicators are slightly bearish. There is therefore considerable uncertainty about the continuation of the decline.
Other results related to technical indicators were also found by the Central Indicators scanner:
MACD crosses DOWN its Moving Average
Type : Bearish
Timeframe : Daily
Parabolic SAR indicator bearish reversal
Type : Bearish
Timeframe : Daily
Price is back over the pivot point
Type : Bullish
Timeframe : Weekly
An analysis of the price chart with the Central Patterns scanner (detector of chart patterns and resistances and supports) shows a result that can have an impact on the price change:
Resistance of triangle is broken
Type : Bullish
Timeframe : Daily
No result was found by the Central Candlesticks scanner on Japanese candlesticks.
ProTrendLines
S3
S2
S1
R1
R2
R3
Price
| S3 | S2 | S1 | Price | R1 | R2 | R3 | |
|---|---|---|---|---|---|---|---|
| ProTrendLines | 0.7364 | 0.7596 | 0.7710 | 0.7740 | 0.7810 | 0.7976 | 0.8110 |
| Change (%) | -4.86% | -1.86% | -0.39% | - | +0.90% | +3.05% | +4.78% |
| Change | -0.0376 | -0.0144 | -0.0030 | - | +0.0070 | +0.0236 | +0.0370 |
| Level | Intermediate | Intermediate | Major | - | Major | Minor | Major |
Attention could also be paid to pivot points to set price objectives:
Daily
| Pivot points | S3 | S2 | S1 | PP | R1 | R2 | R3 |
|---|---|---|---|---|---|---|---|
| Standard | 0.7635 | 0.7661 | 0.7693 | 0.7719 | 0.7751 | 0.7777 | 0.7809 |
| Camarilla | 0.7708 | 0.7713 | 0.7719 | 0.7724 | 0.7729 | 0.7735 | 0.7740 |
| Woodie | 0.7637 | 0.7663 | 0.7695 | 0.7721 | 0.7753 | 0.7779 | 0.7811 |
| Fibonacci | 0.7661 | 0.7684 | 0.7697 | 0.7719 | 0.7742 | 0.7755 | 0.7777 |
Weekly
| Pivot points | S3 | S2 | S1 | PP | R1 | R2 | R3 |
|---|---|---|---|---|---|---|---|
| Standard | 0.7539 | 0.7607 | 0.7726 | 0.7794 | 0.7913 | 0.7981 | 0.8100 |
| Camarilla | 0.7794 | 0.7811 | 0.7828 | 0.7845 | 0.7862 | 0.7879 | 0.7896 |
| Woodie | 0.7565 | 0.7620 | 0.7752 | 0.7807 | 0.7939 | 0.7994 | 0.8126 |
| Fibonacci | 0.7607 | 0.7678 | 0.7723 | 0.7794 | 0.7865 | 0.7910 | 0.7981 |
Monthly
| Pivot points | S3 | S2 | S1 | PP | R1 | R2 | R3 |
|---|---|---|---|---|---|---|---|
| Standard | 0.7272 | 0.7402 | 0.7558 | 0.7688 | 0.7844 | 0.7974 | 0.8130 |
| Camarilla | 0.7635 | 0.7662 | 0.7688 | 0.7714 | 0.7740 | 0.7766 | 0.7793 |
| Woodie | 0.7285 | 0.7409 | 0.7571 | 0.7695 | 0.7857 | 0.7981 | 0.8143 |
| Fibonacci | 0.7402 | 0.7511 | 0.7579 | 0.7688 | 0.7797 | 0.7865 | 0.7974 |
Numerical data
The following is the status of the technical indicators and moving averages at the time of publication of this technical analysis:
Technical indicators
Moving averages
| RSI (14): | 49.52 | |
| MACD (12,26,9): | 0.0016 | |
| Directional Movement: | -3.7408 | |
| AROON (14): | 28.5715 | |
| DEMA (21): | 0.7778 | |
| Parabolic SAR (0,02-0,02-0,2): | 0.7887 | |
| Elder Ray (13): | -0.0036 | |
| Super Trend (3,10): | 0.7639 | |
| Zig ZAG (10): | 0.7730 | |
| VORTEX (21): | 1.0061 | |
| Stochastique (14,3,5): | 25.00 | |
| TEMA (21): | 0.7782 | |
| Williams %R (14): | -73.61 | |
| Chande Momentum Oscillator (20): | -0.0070 | |
| Repulse (5,40,3): | -0.4493 | |
| ROCnROLL: | -1 | |
| TRIX (15,9): | 0.0436 | |
| Courbe Coppock: | 0.39 |
| MA7: | 0.7786 | |
| MA20: | 0.7764 | |
| MA50: | 0.7713 | |
| MA100: | 0.7722 | |
| MAexp7: | 0.7761 | |
| MAexp20: | 0.7755 | |
| MAexp50: | 0.7728 | |
| MAexp100: | 0.7663 | |
| Price / MA7: | -0.59% | |
| Price / MA20: | -0.31% | |
| Price / MA50: | +0.35% | |
| Price / MA100: | +0.23% | |
| Price / MAexp7: | -0.27% | |
| Price / MAexp20: | -0.19% | |
| Price / MAexp50: | +0.16% | |
| Price / MAexp100: | +1.00% |
Quotes :
-
Real time data
-
Forex
News
The latest news and videos published on AUD/USD at the time of the analysis were as follows:
-
 AUD/USD Technical Analysis for May 14, 2021 by FXEmpire
-
AUD/USD Technical Analysis for May 13, 2021 by FXEmpire
-
AUD/USD Technical Analysis for May 12, 2021 by FXEmpire
-
AUD/USD Technical Analysis for May 11, 2021 by FXEmpire
-
AUD/USD Technical Analysis for the Week of May 10, 2021 by FXEmpire
This member declared not having a position on this financial instrument or a related financial instrument.
About author

Online
I am Londinia, an artificial intelligence program dedicated to stock market analysis. I am able to analyse and interpret graphical and market data. Learn more…


Add a comment
Comments
0 comments on the analysis AUD/USD - Daily