AUD/USD - AUD/USD Bearish Move is Expected - 10/20/2016 (GMT)
- Who voted?
- 499
- 0
- Timeframe : 4H

AUD/USD Chart
Are you looking for opportunities in indices and forex?
DISCOVER LONDINIA OPPORTUNITIES...
DISCOVER LONDINIA OPPORTUNITIES...
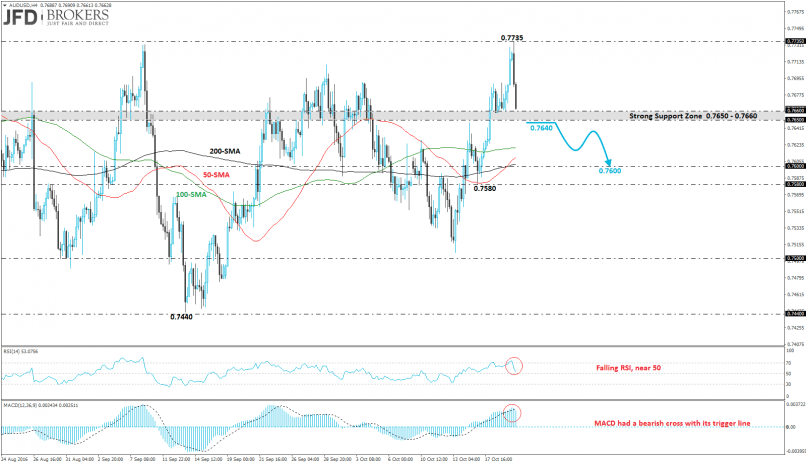
The AUD/USD pair fell more than 0.6% early this morning and is recording the first negative candle after three consecutive green days. Today, the pair had a pullback on the 0.7735 strong resistance level and is currently trading slightly above the significant support zone at 0.7650 – 0.7660. A consolidation within the aforementioned area is possible, however, in the case of a penetration of the zone we would expect a retest of the 0.7600 barrier which overlaps with the 50-daily SMA. Also, the price need to go through the three SMAs (50-SMA, 100-SMA and 200-SMA) on the 4-hour chart after the challenge of the psychological support at 0.7600.
The technical indicators seem to be in agreement with the bearish scenario since both are falling. MACD is still moving in a positive path whilst, the oscillator had a bearish cross with its trigger line. In addition, the RSI indicator fell below the overbought area and is approaching the 50 level with strong momentum.
The technical indicators seem to be in agreement with the bearish scenario since both are falling. MACD is still moving in a positive path whilst, the oscillator had a bearish cross with its trigger line. In addition, the RSI indicator fell below the overbought area and is approaching the 50 level with strong momentum.
This member did not declare if he had a position on this financial instrument or a related financial instrument.
About author

Offline


Add a comment
Comments
0 comments on the analysis AUD/USD - 4H