AUD/USD - Printed a Fresh 3-Month High - 02/03/2017 (GMT)
- Who voted?
- 387
- 0
- Timeframe : 4H
AUD/USD Chart
Are you looking for opportunities in indices and forex?
DISCOVER LONDINIA OPPORTUNITIES...
DISCOVER LONDINIA OPPORTUNITIES...
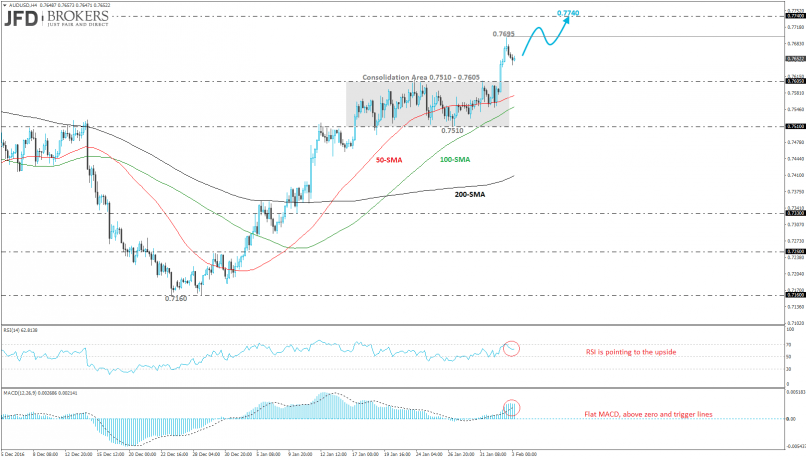
The AUD/USD pair had a strong rally to the upside over yesterday’s session and broke the sideways channel at 0.7510 – 0.7605 that was holding over the last two weeks to the upside. Aussie traded higher against the U.S. dollar and surged more than 1.5% the last five days. Furthermore, the commodity pair printed a new three-month high at 0.7695 and is moving towards the 0.7740 resistance level that we mentioned in the previous analysis (see technical analysis here: http://bit.ly/2kW4F5W).
After the pair exited from the consolidation area, the moving averages are sloping to the upside despite that over the last few hours the price is trading slightly lower. The RSI indicator rebounded on the 70 level and fell, however, now is moving higher again. On the other hand, the MACD oscillator is flattening above its zero and trigger lines.
After the pair exited from the consolidation area, the moving averages are sloping to the upside despite that over the last few hours the price is trading slightly lower. The RSI indicator rebounded on the 70 level and fell, however, now is moving higher again. On the other hand, the MACD oscillator is flattening above its zero and trigger lines.
This member did not declare if he had a position on this financial instrument or a related financial instrument.
About author

Offline


Add a comment
Comments
0 comments on the analysis AUD/USD - 4H