AUD/USD - Edged Sharply Higher at 0.7720 - 02/16/2017 (GMT)
- Who voted?
- 570
- 0
- Timeframe : Daily
AUD/USD Chart
Are you looking for opportunities in indices and forex?
DISCOVER LONDINIA OPPORTUNITIES...
DISCOVER LONDINIA OPPORTUNITIES...
The Australian Dollar ended the day sharply higher versus the U.S. dollar and jumped to a three-month new high near the 0.7720 price level, thanks to the good indicator’s results last night and the weakening in the greenback.
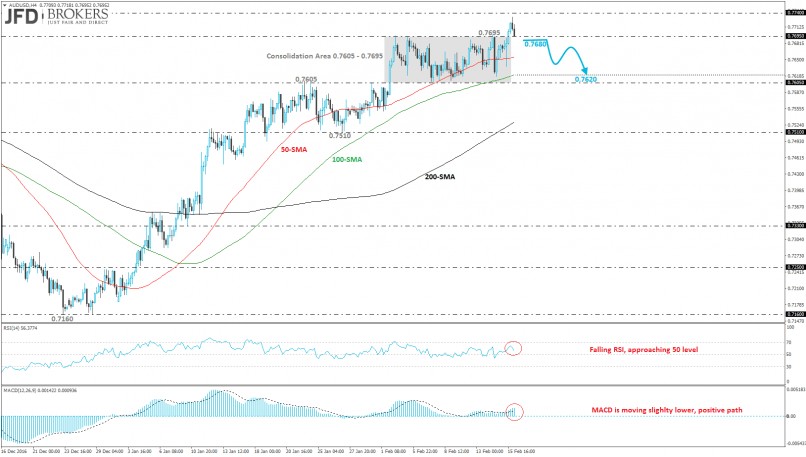
Over the last two weeks, the AUD/USD pair was trading within a sideways channel with support and resistance the 0.7605 and the 0.7695 respectively. Last night the commodity pair surged above the aforementioned support barrier but failed to test the 0.7740 resistance obstacle. Currently, is developing lower and if it slips below 0.7695, it will endorse the scenario for a test of the 100-SMA on the 4-hour chart which is near the 0.7620 support handle. On the same chart, the RSI indicator is falling and is approaching the 50 level whilst the MACD indicator is moving slightly lower with no clear directional strength.
Over the last two weeks, the AUD/USD pair was trading within a sideways channel with support and resistance the 0.7605 and the 0.7695 respectively. Last night the commodity pair surged above the aforementioned support barrier but failed to test the 0.7740 resistance obstacle. Currently, is developing lower and if it slips below 0.7695, it will endorse the scenario for a test of the 100-SMA on the 4-hour chart which is near the 0.7620 support handle. On the same chart, the RSI indicator is falling and is approaching the 50 level whilst the MACD indicator is moving slightly lower with no clear directional strength.
This member did not declare if he had a position on this financial instrument or a related financial instrument.
About author

Offline


Add a comment
Comments
0 comments on the analysis AUD/USD - Daily