AUD/USD - Failed Several Times to Break 0.7500 Barrier - 04/26/2017 (GMT)
- Who voted?
- 359
- 0
- Timeframe : Daily
AUD/USD Chart
Are you looking for opportunities in indices and forex?
DISCOVER LONDINIA OPPORTUNITIES...
DISCOVER LONDINIA OPPORTUNITIES...
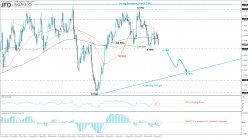
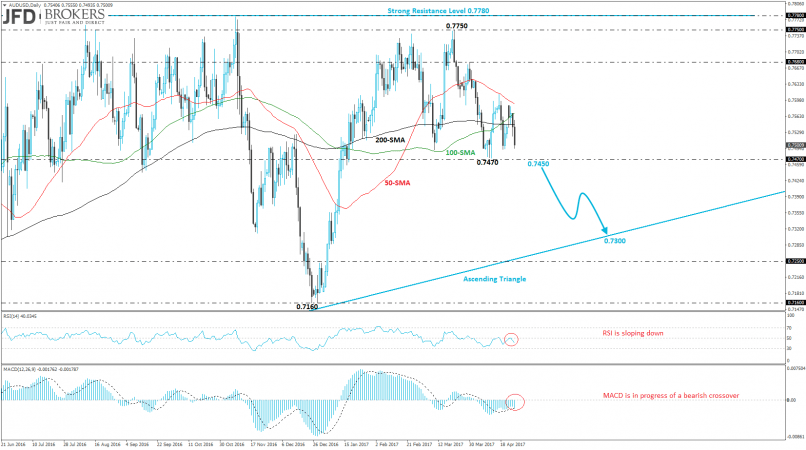
The Australian Dollar is developing in an ascending triangle against the U.S. dollar since last January of 2016 with strong resistance level at 0.7780 and a significant valid uptrend line. Over this week, the AUD/USD pair slipped 0.8% but failed again to have a closing period below 0.7500. Now, the commodity currency is moving slightly lower and is approaching the rising trend line near 0.7300.
From a technical point of view, the price is trading below the three SMAs (50, 100 and 200) SMAs on the daily chart indicating further bearish movement. Technical indicators are strengthening its momentum for a downside move as there are following negative territories. The MACD oscillator is in progress to create a bearish crossover with its trigger line while the RSI indicator is heading to the downside.
From a technical point of view, the price is trading below the three SMAs (50, 100 and 200) SMAs on the daily chart indicating further bearish movement. Technical indicators are strengthening its momentum for a downside move as there are following negative territories. The MACD oscillator is in progress to create a bearish crossover with its trigger line while the RSI indicator is heading to the downside.
This member did not declare if he had a position on this financial instrument or a related financial instrument.
About author

Offline


Add a comment
Comments
0 comments on the analysis AUD/USD - Daily