AUD/USD - Sharp Bullish Run in Progress - Ready to Break Ascending Triangle - 07/14/2017 (GMT)
- Who voted?
- 492
- 0
- Timeframe : Daily
AUD/USD Chart
Are you looking for opportunities in indices and forex?
DISCOVER LONDINIA OPPORTUNITIES...
DISCOVER LONDINIA OPPORTUNITIES...
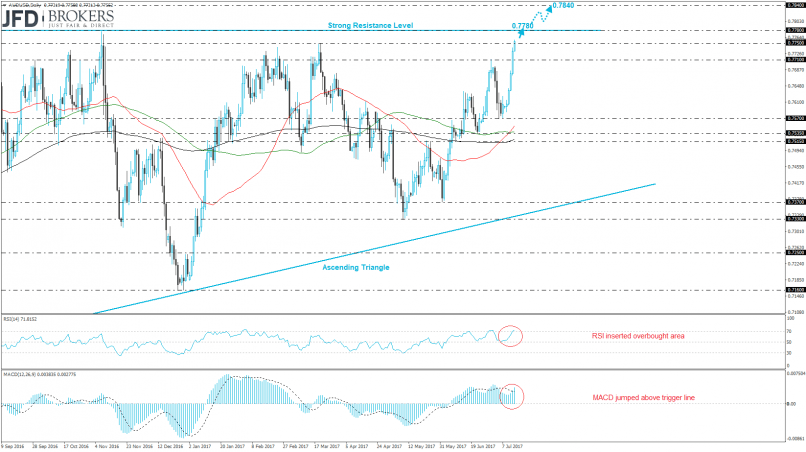
The best performing currency yesterday was the Australian dollar. The AUD/USD pair is printing an aggressive bullish run and recorded six consecutive green days. Meanwhile, the commodity currency pair surged more than 2.2% since last Friday and is approaching the strong resistance level of the ascending triangle which is holding since January of 2016. So, the next level to hit it’s the 0.7780 barrier and if the price climbs above it we may see a challenge of 0.7840.
Technical indicators on the daily chart are biased higher. The MACD oscillator is moving above both, its zero and trigger lines suggesting a stronger pair in the next few periods. In addition, the Relative Strength Index (RSI) is following an upward path above the 70 level in the overbought zone, confirming the recent bullish attitude of the price.
Technical indicators on the daily chart are biased higher. The MACD oscillator is moving above both, its zero and trigger lines suggesting a stronger pair in the next few periods. In addition, the Relative Strength Index (RSI) is following an upward path above the 70 level in the overbought zone, confirming the recent bullish attitude of the price.
This member did not declare if he had a position on this financial instrument or a related financial instrument.
About author

Offline


Add a comment
Comments
0 comments on the analysis AUD/USD - Daily