AUD/USD - AUD/USD: The Sharp Bullish Run Drove the Price to Our Suggested Target at 0 - 07/20/2017 (GMT)
- Who voted?
- 431
- 0
- Timeframe : Daily
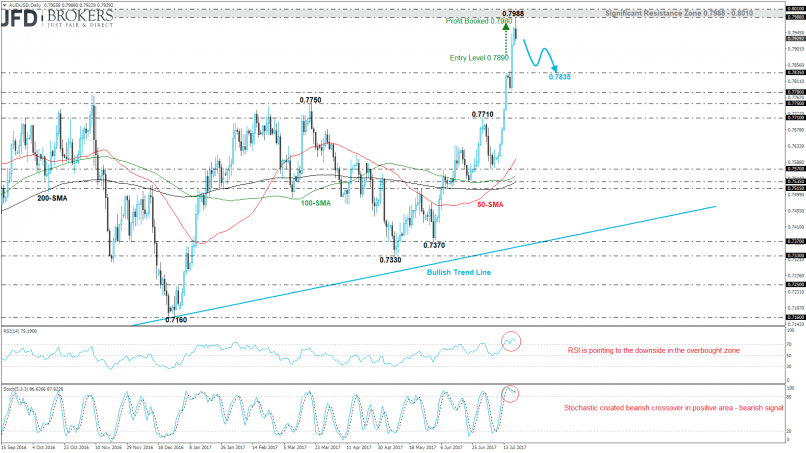
AUD/USD Chart
Are you looking for opportunities in indices and forex?
DISCOVER LONDINIA OPPORTUNITIES...
DISCOVER LONDINIA OPPORTUNITIES...
The Australian dollar had another aggressive rally on Wednesday versus the U.S. dollar and managed to reach a new 2-year high at 0.7988 before the sharp sell-off. The AUD/USD pair is posting the second green month in a row following the pullback on the ascending trend line near 0.7330. The price touched and surpassed our recommended target at 0.7980 (see technical analysis here: AUD/USD Edged Gradually Higher - Soared 1.4% So Far) almost 100 pips gains, and is creating a significant bullish trend.
Since last week, the commodity currency pair added more than 3% at its performance and challenged the 200-month SMA as well as the 200-week SMA. So, our expectation is a downward correction until the 0.7835 support handle. From a technical point of view, the RSI indicator is following the overbought zone but is pointing south signaling for a retracement to the downside. Also, the stochastic oscillator created a bearish crossover within its moving averages confirming the recent fall in price.
Since last week, the commodity currency pair added more than 3% at its performance and challenged the 200-month SMA as well as the 200-week SMA. So, our expectation is a downward correction until the 0.7835 support handle. From a technical point of view, the RSI indicator is following the overbought zone but is pointing south signaling for a retracement to the downside. Also, the stochastic oscillator created a bearish crossover within its moving averages confirming the recent fall in price.
This member did not declare if he had a position on this financial instrument or a related financial instrument.
About author

Offline


Add a comment
Comments
0 comments on the analysis AUD/USD - Daily