AUD/USD - AUD/USD Is Extending Its Gains; Reached 26-Month High - 07/27/2017 (GMT)
- Who voted?
- 406
- 0
- Timeframe : Daily
AUD/USD Chart
Are you looking for opportunities in indices and forex?
DISCOVER LONDINIA OPPORTUNITIES...
DISCOVER LONDINIA OPPORTUNITIES...
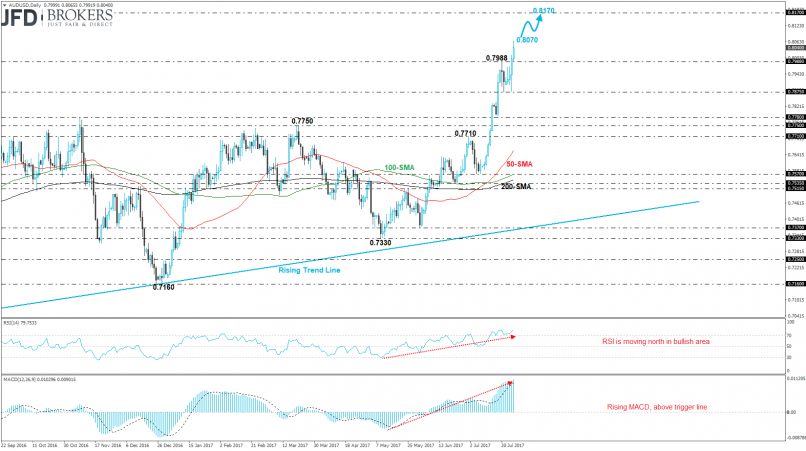
One of the best-performing currencies yesterday was the Australian dollar which destroyed significant levels to the upside versus the U.S. dollar and recorded a fresh 26-month high at 0.8065 early this morning. The AUD/USD pair surpassed successfully key levels such as the 200-week SMA as well as the 200-month SMA and is approaching the 50-month SMA. If there a jump above the latter level, we could see a run towards the 0.8170 resistance handle.
The technical indicators, on the short-term timeframe, seem to in agreement with the bullish attitude on price. The RSI indicator is pointing to the upside in the overbought area, whilst the MACD oscillator is rising above both its trigger and zero lines with strong momentum. The three simple moving averages (50, 100 and 200) are having a bullish mode as there are signaling for further rising.
The technical indicators, on the short-term timeframe, seem to in agreement with the bullish attitude on price. The RSI indicator is pointing to the upside in the overbought area, whilst the MACD oscillator is rising above both its trigger and zero lines with strong momentum. The three simple moving averages (50, 100 and 200) are having a bullish mode as there are signaling for further rising.
This member did not declare if he had a position on this financial instrument or a related financial instrument.
About author

Offline


Add a comment
Comments
0 comments on the analysis AUD/USD - Daily