AUD/USD - Has a Strong Bearish Pressure - Met Our Suggested Target at 0.7750! - 10/25/2017 (GMT)
- Who voted?
- 506
- 0
- Timeframe : Daily

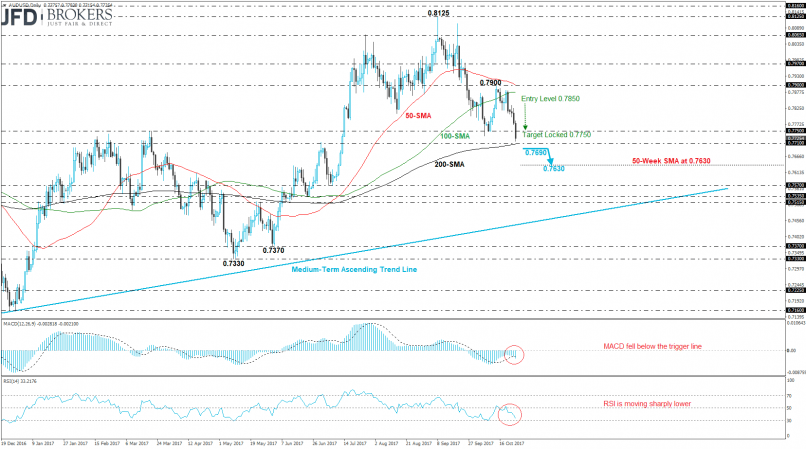
AUD/USD Chart
Are you looking for opportunities in indices and forex?
DISCOVER LONDINIA OPPORTUNITIES...
DISCOVER LONDINIA OPPORTUNITIES...
Aussie is spending the last four days under pressure against the greenback and also today it is having a strong sell-off. The AUD/USD pair plummeted more than 2% following the rebound on the 100-day SMA in the prior week. Additionally, the price reached our target of 100 pips at 0.7750 price level (see technical analysis here: http://bit.ly/2i34lBM) and is trading sharply lower near the strong support barrier at 0.7710, which coincides with the 200-day SMA.
In case of further bearish run, the price will open the door for the next immediate level at 0.7630, which is the 50-week SMA and there are no obstacles until that barrier. Also, on the short-term timeframe, the MACD oscillator printed a downward cross with the trigger line indicating further losses on price. The RSI indicator is heading to south with strong momentum near the 30 level.
In case of further bearish run, the price will open the door for the next immediate level at 0.7630, which is the 50-week SMA and there are no obstacles until that barrier. Also, on the short-term timeframe, the MACD oscillator printed a downward cross with the trigger line indicating further losses on price. The RSI indicator is heading to south with strong momentum near the 30 level.
This member declared not having a position on this financial instrument or a related financial instrument.
About author

Offline


Add a comment
Comments
0 comments on the analysis AUD/USD - Daily