AUD/USD - Posted 3 Straight Negative Months - Plunged 4% - 11/06/2017 (GMT)
- Who voted?
- 269
- 0
- Timeframe : Daily
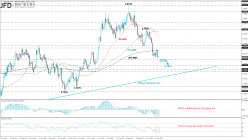

AUD/USD Chart
Are you looking for opportunities in indices and forex?
DISCOVER LONDINIA OPPORTUNITIES...
DISCOVER LONDINIA OPPORTUNITIES...
The AUD/USD pair created the third bearish month in a row and plunged more than 4% since August after the bounce off the 0.7900 psychological level and the 100-week SMA. It is worth to mention that the price touched the 50-week SMA, which is acting as a strong support obstacle for the bulls. However, if the price drops below 0.7625, it will hit the 0.7570 barrier.
Technically, over the last sessions, the price struggled below the 0.7730 resistance level and the 200-daily SMA as is awaiting the Reserve Bank of Australia interest rate decision on Tuesday. The technical indicators (MACD and RSI) are confirming the recent neutral mode as they are moving sideways in the negative zone.
Technically, over the last sessions, the price struggled below the 0.7730 resistance level and the 200-daily SMA as is awaiting the Reserve Bank of Australia interest rate decision on Tuesday. The technical indicators (MACD and RSI) are confirming the recent neutral mode as they are moving sideways in the negative zone.
This member declared not having a position on this financial instrument or a related financial instrument.
About author

Offline


Add a comment
Comments
0 comments on the analysis AUD/USD - Daily