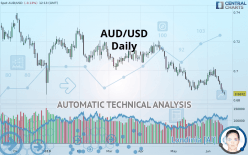
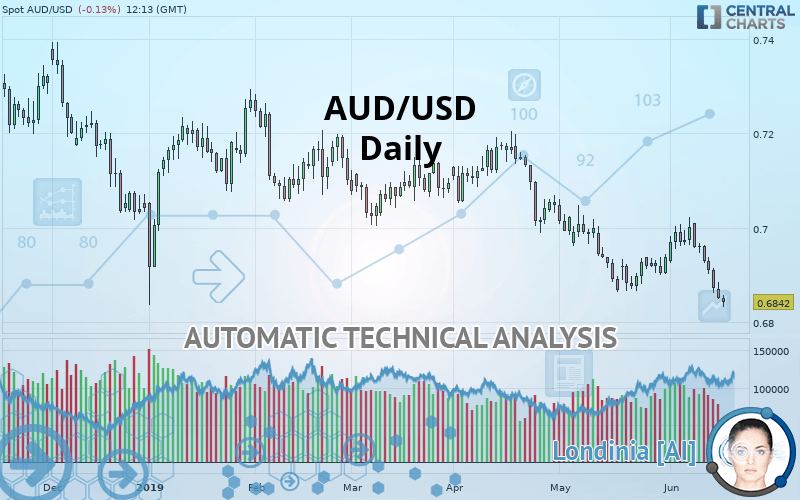
AUD/USD - Daily - Technical analysis published on 06/18/2019 (GMT)
- Who voted?
- 222
- 0
Click here for a new analysis!
- Timeframe : Daily
- - Analysis generated on
- Status : INVALID
Summary of the analysis

Additional analysis
Quotes
The AUD/USD price is 0.6842 USD. The price is lower by -0.13% since the last closing with the lowest point at 0.6832 USD and the highest point at 0.6857 USD. The deviation from the price is +0.15% for the low point and -0.22% for the high point.The Central Gaps scanner detects a bullish opening marking the presence of buyers ahead of sellers at the opening but not sufficiently marked to allow the price to register a quotation gap.
Bullish opening
Type : Bullish
Timeframe : Openning
Here is a more detailed summary of the historical variations registered by AUD/USD:
Near a new LOW record (5 years)
Type : Bearish
Timeframe : Weekly
New LOW record (1 year)
Type : Bearish
Timeframe : Weekly
New LOW record (1st january)
Type : Bearish
Timeframe : Weekly
Near a new HIGH record (1 month)
Type : Bullish
Timeframe : Weekly
New LOW record (1 month)
Type : Bearish
Timeframe : Weekly
Technical
Technical analysis of this Daily chart of AUD/USD indicates that the overall trend is strongly bearish. The signals given by moving averages are 92.86% bearish. This strong bearish trend is confirmed by the strong signals currently being given by short-term moving averages. The Central Indicators scanner detects a bearish signal on moving averages that could impact this trend:
Bearish trend reversal : Moving Average 20
Type : Bearish
Timeframe : Daily
On the 18 technical indicators analysed, 4 are bullish, 3 are neutral and 11 are bearish. But beware of excesses. The Central Indicators scanner currently detects this:
CCI indicator is oversold : under -100
Type : Neutral
Timeframe : Daily
Williams %R indicator is oversold : under -80
Type : Neutral
Timeframe : Daily
Price is back under the pivot point
Type : Bearish
Timeframe : Daily
Price is back under the pivot point
Type : Bearish
Timeframe : Weekly
An analysis of the price chart with the Central Patterns scanner (detector of chart patterns and resistances and supports) shows several results that can have an impact on the price change:
Horizontal support is broken
Type : Bearish
Timeframe : Daily
Support of channel is broken
Type : Bearish
Timeframe : Daily
No result was found by the Central Candlesticks scanner on Japanese candlesticks.
| S1 | Price | R1 | R2 | R3 | |
|---|---|---|---|---|---|
| ProTrendLines | 0.6053 | 0.6842 | 0.6874 | 0.6917 | 0.7060 |
| Change (%) | -11.53% | - | +0.47% | +1.10% | +3.19% |
| Change | -0.0789 | - | +0.0032 | +0.0075 | +0.0218 |
| Level | Minor | - | Major | Intermediate | Intermediate |
Attention could also be paid to pivot points to set price objectives:
| Pivot points | S3 | S2 | S1 | PP | R1 | R2 | R3 |
|---|---|---|---|---|---|---|---|
| Standard | 0.6801 | 0.6824 | 0.6838 | 0.6861 | 0.6875 | 0.6898 | 0.6912 |
| Camarilla | 0.6841 | 0.6844 | 0.6848 | 0.6851 | 0.6854 | 0.6858 | 0.6861 |
| Woodie | 0.6795 | 0.6822 | 0.6833 | 0.6859 | 0.6870 | 0.6896 | 0.6906 |
| Fibonacci | 0.6824 | 0.6838 | 0.6847 | 0.6861 | 0.6875 | 0.6884 | 0.6898 |
| Pivot points | S3 | S2 | S1 | PP | R1 | R2 | R3 |
|---|---|---|---|---|---|---|---|
| Standard | 0.6669 | 0.6765 | 0.6819 | 0.6915 | 0.6969 | 0.7065 | 0.7119 |
| Camarilla | 0.6832 | 0.6845 | 0.6859 | 0.6873 | 0.6887 | 0.6901 | 0.6914 |
| Woodie | 0.6648 | 0.6755 | 0.6798 | 0.6905 | 0.6948 | 0.7054 | 0.7098 |
| Fibonacci | 0.6765 | 0.6822 | 0.6858 | 0.6915 | 0.6972 | 0.7008 | 0.7065 |
Numerical data
The following are the details of the technical indicators and moving averages that were collected to generate this technical analysis:
| RSI (14): | 33.02 | |
| MACD (12,26,9): | -0.0026 | |
| Directional Movement: | -12.9968 | |
| AROON (14): | -50.0000 | |
| DEMA (21): | 0.6893 | |
| Parabolic SAR (0,02-0,02-0,2): | 0.6983 | |
| Elder Ray (13): | -0.0069 | |
| Super Trend (3,10): | 0.6965 | |
| Zig ZAG (10): | 0.6844 | |
| VORTEX (21): | 0.9310 | |
| Stochastique (14,3,5): | 5.16 | |
| TEMA (21): | 0.6892 | |
| Williams %R (14): | -94.21 | |
| Chande Momentum Oscillator (20): | -0.0094 | |
| Repulse (5,40,3): | -0.9688 | |
| ROCnROLL: | 2 | |
| TRIX (15,9): | -0.0367 | |
| Courbe Coppock: | 0.48 |
| MA7: | 0.6904 | |
| MA20: | 0.6927 | |
| MA50: | 0.6992 | |
| MA100: | 0.7054 | |
| MAexp7: | 0.6892 | |
| MAexp20: | 0.6926 | |
| MAexp50: | 0.6976 | |
| MAexp100: | 0.7033 | |
| Price / MA7: | -0.90% | |
| Price / MA20: | -1.23% | |
| Price / MA50: | -2.15% | |
| Price / MA100: | -3.01% | |
| Price / MAexp7: | -0.73% | |
| Price / MAexp20: | -1.21% | |
| Price / MAexp50: | -1.92% | |
| Price / MAexp100: | -2.72% |
News
The latest news and videos published on AUD/USD at the time of the analysis were as follows:
-
 USD/JPY and AUD/USD Forecast June 18, 2019
-
AUD/USD Technical Analysis for June 18, 2019 by FXEmpire
-
USD/JPY and AUD/USD Forecast June 17, 2019
-
AUD/USD Technical Analysis for the week of June 17, 2019 by FXEmpire
-
AUD/USD Technical Analysis for June 17, 2019 by FXEmpire
About author

Online


Add a comment
Comments
0 comments on the analysis AUD/USD - Daily