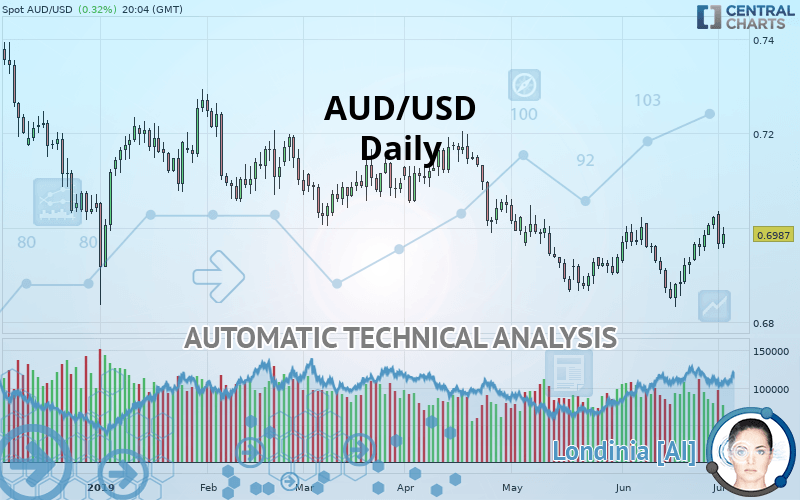
AUD/USD - Daily - Technical analysis published on 07/02/2019 (GMT)
- Who voted?
- 194
- 0
- Timeframe : Daily
- - Analysis generated on
- Status : NEUTRAL

Summary of the analysis

Additional analysis
Quotes
AUD/USD rating 0.6987 USD. The price has increased by +0.32% since the last closing with the lowest point at 0.6958 USD and the highest point at 0.7001 USD. The deviation from the price is +0.42% for the low point and -0.20% for the high point.Here is a more detailed summary of the historical variations registered by AUD/USD:
Near a new LOW record (5 years)
Type : Bearish
Timeframe : Weekly
Technical
Technical analysis of AUD/USD in Daily shows an overall slightly bearish trend. 60.71% of the signals given by moving averages are bearish. Caution: the slightly bullish signals currently given by short-term moving averages could cause a reversal of the trend. The Central Indicators scanner detects bearish signals on moving averages that could impact this trend:
Bearish trend reversal : Moving Average 20
Type : Bearish
Timeframe : Daily
Bearish price crossover with adaptative moving average 50
Type : Bearish
Timeframe : Daily
The probability of a further increase is high given the direction of the technical indicators.
But beware of excesses. The Central Indicators scanner currently detects this:
CCI indicator: bearish divergence
Type : Bearish
Timeframe : Daily
MACD indicator: bearish divergence
Type : Bearish
Timeframe : Daily
Williams %R indicator is overbought : over -20
Type : Neutral
Timeframe : Daily
Ichimoku - Bullish crossover : Tenkan & Kijun
Type : Bullish
Timeframe : Daily
Price is back over the pivot point
Type : Bullish
Timeframe : Weekly
Price is back under the pivot point
Type : Bearish
Timeframe : Daily
Central Patterns, the market scanner focusing on chart patterns, resistances and supports found this result:
Horizontal support is broken
Type : Bearish
Timeframe : Daily
Central Candlesticks, the scanner specialised in Japanese candlesticks, detects a bearish signal that could support the hypothesis of a small drop in the very short term:
Bearish engulfing lines
Type : Bearish
Timeframe : Daily
| S3 | S2 | S1 | Price | R1 | R2 | R3 | |
|---|---|---|---|---|---|---|---|
| ProTrendLines | 0.6053 | 0.6874 | 0.6917 | 0.6987 | 0.7001 | 0.7054 | 0.7176 |
| Change (%) | -13.37% | -1.62% | -1.00% | - | +0.20% | +0.96% | +2.71% |
| Change | -0.0934 | -0.0113 | -0.0070 | - | +0.0014 | +0.0067 | +0.0189 |
| Level | Minor | Major | Minor | - | Major | Minor | Major |
To determine price objectives, it is also possible to use the pivot points. Here is the price position in relation to pivot points:
| Pivot points | S3 | S2 | S1 | PP | R1 | R2 | R3 |
|---|---|---|---|---|---|---|---|
| Standard | 0.6857 | 0.6906 | 0.6936 | 0.6985 | 0.7015 | 0.7064 | 0.7094 |
| Camarilla | 0.6943 | 0.6951 | 0.6958 | 0.6965 | 0.6972 | 0.6979 | 0.6987 |
| Woodie | 0.6847 | 0.6901 | 0.6926 | 0.6980 | 0.7005 | 0.7059 | 0.7084 |
| Fibonacci | 0.6906 | 0.6937 | 0.6955 | 0.6985 | 0.7016 | 0.7034 | 0.7064 |
| Pivot points | S3 | S2 | S1 | PP | R1 | R2 | R3 |
|---|---|---|---|---|---|---|---|
| Standard | 0.6864 | 0.6897 | 0.6959 | 0.6992 | 0.7054 | 0.7087 | 0.7149 |
| Camarilla | 0.6996 | 0.7005 | 0.7013 | 0.7022 | 0.7031 | 0.7039 | 0.7048 |
| Woodie | 0.6880 | 0.6904 | 0.6974 | 0.6999 | 0.7070 | 0.7094 | 0.7164 |
| Fibonacci | 0.6897 | 0.6933 | 0.6955 | 0.6992 | 0.7028 | 0.7050 | 0.7087 |
Numerical data
The following is the status of the technical indicators and moving averages at the time of publication of this technical analysis:
| RSI (14): | 55.08 | |
| MACD (12,26,9): | 0.0009 | |
| Directional Movement: | 2.9845 | |
| AROON (14): | 64.2857 | |
| DEMA (21): | 0.6961 | |
| Parabolic SAR (0,02-0,02-0,2): | 0.6913 | |
| Elder Ray (13): | 0.0017 | |
| Super Trend (3,10): | 0.6891 | |
| Zig ZAG (10): | 0.6987 | |
| VORTEX (21): | 1.0338 | |
| Stochastique (14,3,5): | 80.28 | |
| TEMA (21): | 0.6986 | |
| Williams %R (14): | -23.65 | |
| Chande Momentum Oscillator (20): | 0.0114 | |
| Repulse (5,40,3): | -0.0067 | |
| ROCnROLL: | 1 | |
| TRIX (15,9): | -0.0039 | |
| Courbe Coppock: | 1.10 |
| MA7: | 0.6984 | |
| MA20: | 0.6947 | |
| MA50: | 0.6955 | |
| MA100: | 0.7034 | |
| MAexp7: | 0.6977 | |
| MAexp20: | 0.6956 | |
| MAexp50: | 0.6973 | |
| MAexp100: | 0.7022 | |
| Price / MA7: | +0.04% | |
| Price / MA20: | +0.58% | |
| Price / MA50: | +0.46% | |
| Price / MA100: | -0.67% | |
| Price / MAexp7: | +0.14% | |
| Price / MAexp20: | +0.45% | |
| Price / MAexp50: | +0.20% | |
| Price / MAexp100: | -0.50% |
News
The last news published on AUD/USD at the time of the generation of this analysis was as follows:
-
 USD/JPY and AUD/USD Forecast July 3, 2019
-
AUD/USD Technical Analysis for July 03, 2019 by FXEmpire
-
Stocks slide as US threatens tariffs on Europe, AUDUSD sees gains
-
USD/JPY and AUD/USD Forecast July 2, 2019
-
AUD/USD Technical Analysis for July 02, 2019 by FXEmpire
About author

Online


Add a comment
Comments
0 comments on the analysis AUD/USD - Daily