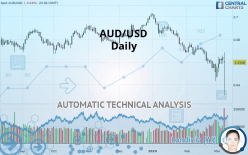
AUD/USD - Daily - Technical analysis published on 03/09/2020 (GMT)
- Who voted?
- 223
- 0
Click here for a new analysis!
- Timeframe : Daily
- - Analysis generated on
- Status : TARGET REACHED

Summary of the analysis

Additional analysis
Quotes
The AUD/USD rating is 0.6598 USD. On the day, this instrument gained -0.63% and was between 0.6307 USD and 0.6685 USD. This implies that the price is at +4.61% from its lowest and at -1.30% from its highest.The Central Gaps scanner detects a bearish opening. A small advantage for sellers in the very short term.
Bearish opening
Type : Bearish
Timeframe : Openning
A study of price movements over other periods shows the following variations:
New LOW record (5 years)
Type : Bearish
Timeframe : Weekly
New LOW record (1 year)
Type : Bearish
Timeframe : Weekly
New LOW record (1st january)
Type : Bearish
Timeframe : Weekly
Near a new HIGH record (1 month)
Type : Bullish
Timeframe : Weekly
New LOW record (1 month)
Type : Bearish
Timeframe : Weekly
Technical
A technical analysis in Daily of this AUD/USD chart shows a sharp bearish trend. The signals given by moving averages are 92.86% bearish. This strong bearish trend is confirmed by the strong signals currently being given by short-term moving averages. The Central Indicators market scanner is currently detecting a bullish signal that could impact this trend:
Bullish price crossover with Moving Average 20
Type : Bullish
Timeframe : Daily
In fact, Central Analyzer took into account 18 technical indicators and the result was as follows: 9 are bullish, 4 are neutral and 5 are bearish. Caution: the Central Indicators scanner currently detects an excess:
Williams %R indicator is overbought : over -20
Type : Neutral
Timeframe : Daily
Price is back over the pivot point
Type : Bullish
Timeframe : Daily
Price is back over the pivot point
Type : Bullish
Timeframe : Weekly
The Central Patterns scanner, which studies chart patterns, resistances and supports, has identified these signals:
Resistance of channel is broken
Type : Bullish
Timeframe : Daily
Horizontal support is broken
Type : Bearish
Timeframe : Daily
The Central Candlesticks scanner, specialised in Japanese candlesticks, did not identify any signals.
| S2 | S1 | Price | R1 | R2 | R3 | |
|---|---|---|---|---|---|---|
| ProTrendLines | 0.6053 | 0.6511 | 0.6598 | 0.6708 | 0.6762 | 0.6874 |
| Change (%) | -8.26% | -1.32% | - | +1.67% | +2.49% | +4.18% |
| Change | -0.0545 | -0.0087 | - | +0.0110 | +0.0164 | +0.0276 |
| Level | Intermediate | Intermediate | - | Intermediate | Minor | Intermediate |
To determine price objectives, it is also possible to use the pivot points. Here is the price position in relation to pivot points:
| Pivot points | S3 | S2 | S1 | PP | R1 | R2 | R3 |
|---|---|---|---|---|---|---|---|
| Standard | 0.6526 | 0.6555 | 0.6598 | 0.6627 | 0.6670 | 0.6699 | 0.6742 |
| Camarilla | 0.6620 | 0.6627 | 0.6633 | 0.6640 | 0.6647 | 0.6653 | 0.6660 |
| Woodie | 0.6532 | 0.6559 | 0.6604 | 0.6631 | 0.6676 | 0.6703 | 0.6748 |
| Fibonacci | 0.6555 | 0.6583 | 0.6600 | 0.6627 | 0.6655 | 0.6672 | 0.6699 |
| Pivot points | S3 | S2 | S1 | PP | R1 | R2 | R3 |
|---|---|---|---|---|---|---|---|
| Standard | 0.6324 | 0.6394 | 0.6517 | 0.6587 | 0.6710 | 0.6780 | 0.6903 |
| Camarilla | 0.6587 | 0.6605 | 0.6622 | 0.6640 | 0.6658 | 0.6675 | 0.6693 |
| Woodie | 0.6351 | 0.6407 | 0.6544 | 0.6600 | 0.6737 | 0.6793 | 0.6930 |
| Fibonacci | 0.6394 | 0.6468 | 0.6513 | 0.6587 | 0.6661 | 0.6706 | 0.6780 |
| Pivot points | S3 | S2 | S1 | PP | R1 | R2 | R3 |
|---|---|---|---|---|---|---|---|
| Standard | 0.6032 | 0.6233 | 0.6372 | 0.6573 | 0.6712 | 0.6913 | 0.7052 |
| Camarilla | 0.6418 | 0.6449 | 0.6480 | 0.6511 | 0.6542 | 0.6573 | 0.6605 |
| Woodie | 0.6001 | 0.6218 | 0.6341 | 0.6558 | 0.6681 | 0.6898 | 0.7021 |
| Fibonacci | 0.6233 | 0.6363 | 0.6443 | 0.6573 | 0.6703 | 0.6783 | 0.6913 |
Numerical data
The following are the details of the technical indicators and moving averages that were collected to generate this technical analysis:
| RSI (14): | 42.64 | |
| MACD (12,26,9): | -0.0042 | |
| Directional Movement: | -29.4263 | |
| AROON (14): | -100.0000 | |
| DEMA (21): | 0.6573 | |
| Parabolic SAR (0,02-0,02-0,2): | 0.6657 | |
| Elder Ray (13): | -0.0118 | |
| Super Trend (3,10): | 0.6683 | |
| Zig ZAG (10): | 0.6602 | |
| VORTEX (21): | 0.7718 | |
| Stochastique (14,3,5): | 69.52 | |
| TEMA (21): | 0.6574 | |
| Williams %R (14): | -26.93 | |
| Chande Momentum Oscillator (20): | -0.0012 | |
| Repulse (5,40,3): | 2.9406 | |
| ROCnROLL: | 2 | |
| TRIX (15,9): | -0.1141 | |
| Courbe Coppock: | 2.81 |
| MA7: | 0.6590 | |
| MA20: | 0.6633 | |
| MA50: | 0.6754 | |
| MA100: | 0.6804 | |
| MAexp7: | 0.6605 | |
| MAexp20: | 0.6634 | |
| MAexp50: | 0.6712 | |
| MAexp100: | 0.6770 | |
| Price / MA7: | +0.12% | |
| Price / MA20: | -0.53% | |
| Price / MA50: | -2.31% | |
| Price / MA100: | -3.03% | |
| Price / MAexp7: | -0.11% | |
| Price / MAexp20: | -0.54% | |
| Price / MAexp50: | -1.70% | |
| Price / MAexp100: | -2.54% |
News
The last news published on AUD/USD at the time of the generation of this analysis was as follows:
-
 USD/JPY and AUD/USD Forecast March 10, 2020
-
AUD/USD Technical Analysis for March 10, 2020 by FXEmpire
-
USD/JPY and AUD/USD Forecast March 9, 2020
-
AUD/USD Technical Analysis for the Week of March 9, 2020 by FXEmpire
-
AUD/USD Technical Analysis for March 9, 2020 by FXEmpire
About author

Online


Add a comment
Comments
0 comments on the analysis AUD/USD - Daily