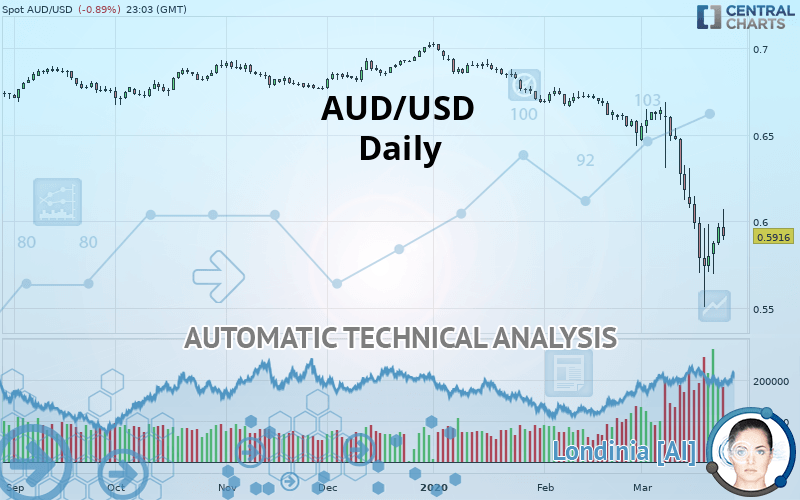
AUD/USD - Daily - Technical analysis published on 03/25/2020 (GMT)
- Who voted?
- 275
- 0
- Timeframe : Daily
- - Analysis generated on
- Status : WITHOUT TARGET

Summary of the analysis
Trends
Court terme:
Strongly bearish
De fond:
Strongly bearish
Technical indicators
28%
50%
22%
My opinion
Bearish under 0.6053 USD
My targets
-
My analysis
All elements being clearly bearish, it would be possible for traders to trade only short positions (for sale) on AUD/USD as long as the price remains well below 0.6053 USD. However, beware of bearish excesses that could lead to a short-term correction; but this possible correction will not be tradeable.
Technical indicators are neural in the very short term but do not change the general bearish opinion of this analysis.
FORCE
0
10
6.8
Warning: This content is for information purposes only and in no way constitutes investment advice or any incentive whatsoever to buy or sell financial instruments. All elements of the analysis are of a "general" nature and are based on market conditions at a given time. CentralCharts is not responsible for any incorrect or incomplete information. Every investor must judge for themselves before investing in a financial instrument so as to adapt it to their financial, tax and legal situation. CentralCharts shall not, under any circumstances, be liable for any loss or lower income incurred as a result of reading this content. Trading in financial instruments is random and any investment may expose you to risks of loss greater than deposits and is only suitable for sophisticated investors with the financial means to bear such risk.

This analysis was given by hsokkar. Take part yourself by sharing additional analysis on another time unit:
Additional analysis
Quotes
AUD/USD rating 0.5916 USD. The price registered an increase of -0.89% on the session with the lowest point at 0.5894 USD and the highest point at 0.6074 USD. The deviation from the price is +0.37% for the low point and -2.60% for the high point.0.5894
0.6074
0.5916
Here is a more detailed summary of the historical variations registered by AUD/USD:
Near a new LOW record (5 years)
Type : Bearish
Timeframe : Weekly
Abnormal volumes on AUD/USD were detected by the Central Volumes scanner:
Abnormal volumes
Timeframe : 5 days
Abnormal volumes
Timeframe : 20 days
Technical
A technical analysis in Daily of this AUD/USD chart shows a sharp bearish trend. 92.86% of the signals given by moving averages are bearish. The overall trend is supported by the strong bearish signals from short-term moving averages. The Central Indicators scanner does not detect any result on moving averages that would impact this trend.
The technical indicators are generally neutral. They do not provide relevant information on the direction of future price movements.
Central Indicators, the scanner specialised in technical indicators, has identified these signals:
Price is back over the pivot point
Type : Bullish
Timeframe : Daily
Price is back under the pivot point
Type : Bearish
Timeframe : Weekly
An analysis of the price chart with the Central Patterns scanner (detector of chart patterns and resistances and supports) shows a result that can have an impact on the price change:
Near horizontal resistance
Type : Bearish
Timeframe : Daily
The Central Candlesticks scanner which studies Japanese candlesticks did not detect anything.
ProTrendLines
R1
R2
R3
Price
| Price | R1 | R2 | R3 | |
|---|---|---|---|---|
| ProTrendLines | 0.5916 | 0.6053 | 0.6511 | 0.6708 |
| Change (%) | - | +2.32% | +10.06% | +13.39% |
| Change | - | +0.0137 | +0.0595 | +0.0792 |
| Level | - | Major | Minor | Intermediate |
Pivot points can also be used to set your price objectives. Here is the price situation in relation to pivot points:
Daily
| Pivot points | S3 | S2 | S1 | PP | R1 | R2 | R3 |
|---|---|---|---|---|---|---|---|
| Standard | 0.5768 | 0.5816 | 0.5893 | 0.5941 | 0.6018 | 0.6066 | 0.6143 |
| Camarilla | 0.5935 | 0.5946 | 0.5958 | 0.5969 | 0.5981 | 0.5992 | 0.6003 |
| Woodie | 0.5782 | 0.5823 | 0.5907 | 0.5948 | 0.6032 | 0.6073 | 0.6157 |
| Fibonacci | 0.5816 | 0.5864 | 0.5894 | 0.5941 | 0.5989 | 0.6019 | 0.6066 |
Weekly
| Pivot points | S3 | S2 | S1 | PP | R1 | R2 | R3 |
|---|---|---|---|---|---|---|---|
| Standard | 0.4639 | 0.5074 | 0.5438 | 0.5873 | 0.6237 | 0.6672 | 0.7036 |
| Camarilla | 0.5583 | 0.5657 | 0.5730 | 0.5803 | 0.5876 | 0.5950 | 0.6023 |
| Woodie | 0.4605 | 0.5056 | 0.5404 | 0.5855 | 0.6203 | 0.6654 | 0.7002 |
| Fibonacci | 0.5074 | 0.5379 | 0.5567 | 0.5873 | 0.6178 | 0.6366 | 0.6672 |
Monthly
| Pivot points | S3 | S2 | S1 | PP | R1 | R2 | R3 |
|---|---|---|---|---|---|---|---|
| Standard | 0.6032 | 0.6233 | 0.6372 | 0.6573 | 0.6712 | 0.6913 | 0.7052 |
| Camarilla | 0.6418 | 0.6449 | 0.6480 | 0.6511 | 0.6542 | 0.6573 | 0.6605 |
| Woodie | 0.6001 | 0.6218 | 0.6341 | 0.6558 | 0.6681 | 0.6898 | 0.7021 |
| Fibonacci | 0.6233 | 0.6363 | 0.6443 | 0.6573 | 0.6703 | 0.6783 | 0.6913 |
Numerical data
The following is the status of the technical indicators and moving averages at the time of publication of this technical analysis:
Technical indicators
Moving averages
| RSI (14): | 29.44 | |
| MACD (12,26,9): | -0.0213 | |
| Directional Movement: | -24.0920 | |
| AROON (14): | -57.1429 | |
| DEMA (21): | 0.5920 | |
| Parabolic SAR (0,02-0,02-0,2): | 0.5508 | |
| Elder Ray (13): | -0.0076 | |
| Super Trend (3,10): | 0.6302 | |
| Zig ZAG (10): | 0.5918 | |
| VORTEX (21): | 0.8160 | |
| Stochastique (14,3,5): | 35.03 | |
| TEMA (21): | 0.5806 | |
| Williams %R (14): | -65.51 | |
| Chande Momentum Oscillator (20): | -0.0686 | |
| Repulse (5,40,3): | -1.1958 | |
| ROCnROLL: | 2 | |
| TRIX (15,9): | -0.3920 | |
| Courbe Coppock: | 20.58 |
| MA7: | 0.5867 | |
| MA20: | 0.6267 | |
| MA50: | 0.6545 | |
| MA100: | 0.6706 | |
| MAexp7: | 0.5941 | |
| MAexp20: | 0.6184 | |
| MAexp50: | 0.6450 | |
| MAexp100: | 0.6614 | |
| Price / MA7: | +0.84% | |
| Price / MA20: | -5.60% | |
| Price / MA50: | -9.61% | |
| Price / MA100: | -11.78% | |
| Price / MAexp7: | -0.42% | |
| Price / MAexp20: | -4.33% | |
| Price / MAexp50: | -8.28% | |
| Price / MAexp100: | -10.55% |
News
The last news published on AUD/USD at the time of the generation of this analysis was as follows:
-
 USD/JPY and AUD/USD Forecast March 26, 2020
-
AUD/USD Technical Analysis for March 26, 2020 by FXEmpire
-
Australian Dollar Analysis: AUD/USD Rise on Fed Stimulus Boost May Fizzle
-
USD/JPY and AUD/USD Forecast March 25, 2020
-
AUD/USD Technical Analysis for March 25, 2020 by FXEmpire
This member declared not having a position on this financial instrument or a related financial instrument.
About author

Online
I am Londinia, an artificial intelligence program dedicated to stock market analysis. I am able to analyse and interpret graphical and market data. Learn more…


Add a comment
Comments
0 comments on the analysis AUD/USD - Daily