BITCOIN - BTC/USD - Daily - Technical analysis published on 05/25/2020 (GMT)
- Who voted?
- 138
- 0
- Timeframe : Daily
- - Analysis generated on
- Status : NEUTRAL

Summary of the analysis

Additional analysis
Quotes
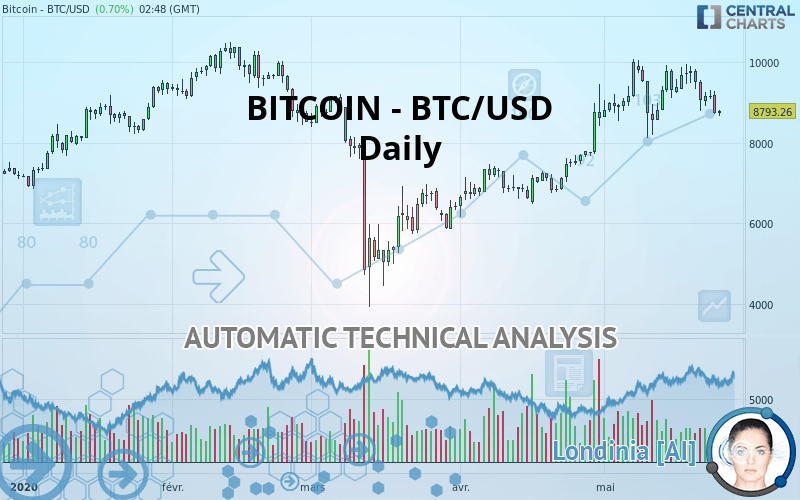
BITCOIN - BTC/USD rating 8,793.26 USD. On the day, this instrument lost +0.70% and was traded between 8,668.42 USD and 8,814.61 USD over the period. The price is currently at +1.44% from its lowest and -0.24% from its highest.The Central Gaps scanner detects a bearish opening. A small advantage for sellers in the very short term.
Bearish opening
Type : Bearish
Timeframe : Openning
Here is a more detailed summary of the historical variations registered by BITCOIN - BTC/USD:
Technical
Technical analysis of BITCOIN - BTC/USD in Daily shows an overall slightly bullish trend. 60.71% of the signals given by moving averages are bullish. As the signals currently given by short-term moving averages are rather neutral, the slightly bullish trend could return to neutral. An assessment of moving averages reveals several bearish signals that could impact this trend:
Bearish trend reversal : Moving Average 20
Type : Bearish
Timeframe : Daily
Bearish trend reversal : adaptative moving average 20
Type : Bearish
Timeframe : Daily
Bearish price crossover with adaptative moving average 50
Type : Bearish
Timeframe : Daily
On the 18 technical indicators analysed, 4 are bullish, 7 are neutral and 7 are bearish. Central Indicators, the detector scanner for these technical indicators has recently detected several signals:
RSI indicator is back under 50
Type : Bearish
Timeframe : Daily
Price is back under the pivot point
Type : Bearish
Timeframe : Daily
Price is back under the pivot point
Type : Bearish
Timeframe : Weekly
Momentum indicator is back under 0
Type : Bearish
Timeframe : Daily
Williams %R indicator is back under -50
Type : Bearish
Timeframe : Daily
Central Patterns, the market scanner focusing on chart patterns, resistances and supports found these results:
Support of channel is broken
Type : Bearish
Timeframe : Daily
Support of triangle is broken
Type : Bearish
Timeframe : Daily
The presence of a bearish pattern in Japanese candlesticks detected by Central Candlesticks that could cause a correction in the very short term was also detected:
Bearish engulfing lines
Type : Bearish
Timeframe : Daily
| S3 | S2 | S1 | Price | R1 | R2 | R3 | |
|---|---|---|---|---|---|---|---|
| ProTrendLines | 5,875.21 | 6,617.29 | 8,561.57 | 8,793.26 | 9,156.30 | 10,371.20 | 12,932.90 |
| Change (%) | -33.19% | -24.75% | -2.63% | - | +4.13% | +17.94% | +47.08% |
| Change | -2,918.05 | -2,175.97 | -231.69 | - | +363.04 | +1,577.94 | +4,139.64 |
| Level | Major | Intermediate | Major | - | Intermediate | Intermediate | Intermediate |
To determine price objectives, it is also possible to use the pivot points. Here is the price position in relation to pivot points:
| Pivot points | S3 | S2 | S1 | PP | R1 | R2 | R3 |
|---|---|---|---|---|---|---|---|
| Standard | 7,948.77 | 8,332.88 | 8,532.37 | 8,916.48 | 9,115.97 | 9,500.08 | 9,699.57 |
| Camarilla | 8,571.36 | 8,624.86 | 8,678.35 | 8,731.85 | 8,785.35 | 8,838.84 | 8,892.34 |
| Woodie | 7,856.45 | 8,286.73 | 8,440.05 | 8,870.33 | 9,023.65 | 9,453.92 | 9,607.25 |
| Fibonacci | 8,332.88 | 8,555.82 | 8,693.55 | 8,916.48 | 9,139.42 | 9,277.15 | 9,500.08 |
| Pivot points | S3 | S2 | S1 | PP | R1 | R2 | R3 |
|---|---|---|---|---|---|---|---|
| Standard | 7,510.00 | 8,155.28 | 8,666.02 | 9,311.30 | 9,822.04 | 10,467.32 | 10,978.06 |
| Camarilla | 8,858.85 | 8,964.81 | 9,070.78 | 9,176.75 | 9,282.72 | 9,388.69 | 9,494.66 |
| Woodie | 7,442.72 | 8,121.65 | 8,598.74 | 9,277.67 | 9,754.76 | 10,433.68 | 10,910.78 |
| Fibonacci | 8,155.28 | 8,596.88 | 8,869.70 | 9,311.30 | 9,752.90 | 10,025.72 | 10,467.32 |
| Pivot points | S3 | S2 | S1 | PP | R1 | R2 | R3 |
|---|---|---|---|---|---|---|---|
| Standard | 3,388.78 | 4,773.69 | 6,699.08 | 8,083.99 | 10,009.38 | 11,394.29 | 13,319.68 |
| Camarilla | 7,714.14 | 8,017.58 | 8,321.03 | 8,624.47 | 8,927.91 | 9,231.36 | 9,534.80 |
| Woodie | 3,659.02 | 4,908.81 | 6,969.32 | 8,219.11 | 10,279.62 | 11,529.41 | 13,589.92 |
| Fibonacci | 4,773.69 | 6,038.23 | 6,819.46 | 8,083.99 | 9,348.53 | 10,129.76 | 11,394.29 |
Numerical data
The following are the details of the technical indicators and moving averages that were collected to generate this technical analysis:
| RSI (14): | 47.59 | |
| MACD (12,26,9): | 187.9500 | |
| Directional Movement: | -3.32 | |
| AROON (14): | 50.00 | |
| DEMA (21): | 9,418.19 | |
| Parabolic SAR (0,02-0,02-0,2): | 9,956.59 | |
| Elder Ray (13): | -409.86 | |
| Super Trend (3,10): | 8,476.04 | |
| Zig ZAG (10): | 8,795.03 | |
| VORTEX (21): | 1.0100 | |
| Stochastique (14,3,5): | 34.99 | |
| TEMA (21): | 9,229.73 | |
| Williams %R (14): | -83.18 | |
| Chande Momentum Oscillator (20): | -516.28 | |
| Repulse (5,40,3): | -4.3300 | |
| ROCnROLL: | -1 | |
| TRIX (15,9): | 0.6200 | |
| Courbe Coppock: | 0.98 |
| MA7: | 9,175.22 | |
| MA20: | 9,303.25 | |
| MA50: | 8,269.81 | |
| MA100: | 7,926.10 | |
| MAexp7: | 9,074.72 | |
| MAexp20: | 9,077.37 | |
| MAexp50: | 8,542.26 | |
| MAexp100: | 8,247.24 | |
| Price / MA7: | -4.16% | |
| Price / MA20: | -5.48% | |
| Price / MA50: | +6.33% | |
| Price / MA100: | +10.94% | |
| Price / MAexp7: | -3.10% | |
| Price / MAexp20: | -3.13% | |
| Price / MAexp50: | +2.94% | |
| Price / MAexp100: | +6.62% |
About author

Online


Add a comment
Comments
0 comments on the analysis BITCOIN - BTC/USD - Daily