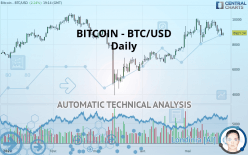
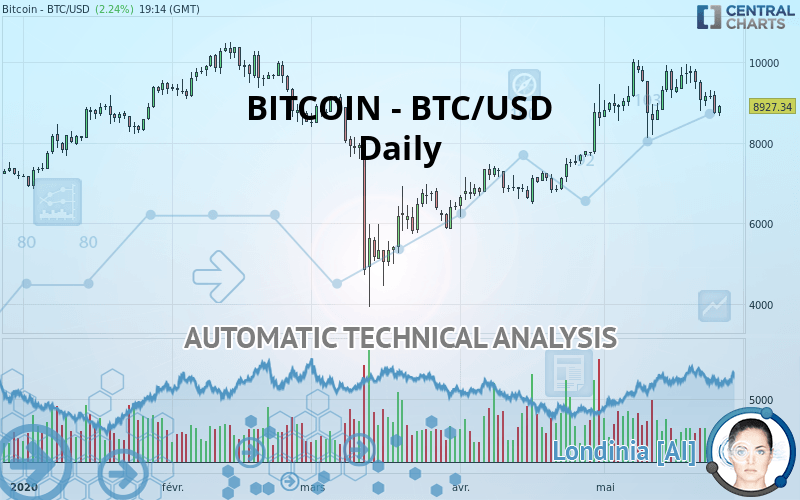
BITCOIN - BTC/USD - Daily - Technical analysis published on 05/25/2020 (GMT)
- Who voted?
- 164
- 0
- Timeframe : Daily
- - Analysis generated on
- Status : NEUTRAL
Summary of the analysis

Additional analysis
Quotes
BITCOIN - BTC/USD rating 8,927.34 USD. On the day, this instrument lost +2.24% and was traded between 8,668.42 USD and 8,935.18 USD over the period. The price is currently at +2.99% from its lowest and -0.09% from its highest.The Central Gaps scanner detects a bearish opening marking the presence of sellers ahead of buyers at the opening but not sufficiently marked to allow the price to register a quotation gap.
Bearish opening
Type : Bearish
Timeframe : Openning
So that you have an overall view of the price change, here is a table showing the variations over several periods:
Technical
Technical analysis of this Daily chart of BITCOIN - BTC/USD indicates that the overall trend is slightly bullish. 60.71% of the signals given by moving averages are bullish. As the signals currently given by short-term moving averages are rather neutral, the slightly bullish trend could return to neutral. The Central Indicators scanner detects bearish signals on moving averages that could impact this trend:
Bearish trend reversal : Moving Average 20
Type : Bearish
Timeframe : Daily
Bearish trend reversal : adaptative moving average 20
Type : Bearish
Timeframe : Daily
Bearish price crossover with adaptative moving average 50
Type : Bearish
Timeframe : Daily
An assessment of technical indicators does not currently provide any relevant information on the direction of future price movements.
Other results related to technical indicators were also found by the Central Indicators scanner:
RSI indicator is back under 50
Type : Bearish
Timeframe : Daily
Price is back under the pivot point
Type : Bearish
Timeframe : Daily
Price is back under the pivot point
Type : Bearish
Timeframe : Weekly
Momentum indicator is back under 0
Type : Bearish
Timeframe : Daily
Williams %R indicator is back under -50
Type : Bearish
Timeframe : Daily
Central Patterns, the market scanner focusing on chart patterns, resistances and supports found these results:
Near horizontal support
Type : Bullish
Timeframe : Daily
Support of channel is broken
Type : Bearish
Timeframe : Daily
Support of triangle is broken
Type : Bearish
Timeframe : Daily
Central Candlesticks, the scanner specialised in Japanese candlesticks, detects a bearish signal that could support the hypothesis of a small drop in the very short term:
Bearish engulfing lines
Type : Bearish
Timeframe : Daily
| S3 | S2 | S1 | Price | R1 | R2 | R3 | |
|---|---|---|---|---|---|---|---|
| ProTrendLines | 5,875.21 | 6,617.29 | 8,561.57 | 8,927.34 | 9,156.30 | 10,371.20 | 12,932.90 |
| Change (%) | -34.19% | -25.88% | -4.10% | - | +2.56% | +16.17% | +44.87% |
| Change | -3,052.13 | -2,310.05 | -365.77 | - | +228.96 | +1,443.86 | +4,005.56 |
| Level | Major | Intermediate | Major | - | Intermediate | Intermediate | Intermediate |
Pivot points can also be used to set your price objectives. Here is the price situation in relation to pivot points:
| Pivot points | S3 | S2 | S1 | PP | R1 | R2 | R3 |
|---|---|---|---|---|---|---|---|
| Standard | 7,948.77 | 8,332.88 | 8,532.37 | 8,916.48 | 9,115.97 | 9,500.08 | 9,699.57 |
| Camarilla | 8,571.36 | 8,624.86 | 8,678.35 | 8,731.85 | 8,785.35 | 8,838.84 | 8,892.34 |
| Woodie | 7,856.45 | 8,286.73 | 8,440.05 | 8,870.33 | 9,023.65 | 9,453.92 | 9,607.25 |
| Fibonacci | 8,332.88 | 8,555.82 | 8,693.55 | 8,916.48 | 9,139.42 | 9,277.15 | 9,500.08 |
| Pivot points | S3 | S2 | S1 | PP | R1 | R2 | R3 |
|---|---|---|---|---|---|---|---|
| Standard | 7,510.00 | 8,155.28 | 8,666.02 | 9,311.30 | 9,822.04 | 10,467.32 | 10,978.06 |
| Camarilla | 8,858.85 | 8,964.81 | 9,070.78 | 9,176.75 | 9,282.72 | 9,388.69 | 9,494.66 |
| Woodie | 7,442.72 | 8,121.65 | 8,598.74 | 9,277.67 | 9,754.76 | 10,433.68 | 10,910.78 |
| Fibonacci | 8,155.28 | 8,596.88 | 8,869.70 | 9,311.30 | 9,752.90 | 10,025.72 | 10,467.32 |
| Pivot points | S3 | S2 | S1 | PP | R1 | R2 | R3 |
|---|---|---|---|---|---|---|---|
| Standard | 3,388.78 | 4,773.69 | 6,699.08 | 8,083.99 | 10,009.38 | 11,394.29 | 13,319.68 |
| Camarilla | 7,714.14 | 8,017.58 | 8,321.03 | 8,624.47 | 8,927.91 | 9,231.36 | 9,534.80 |
| Woodie | 3,659.02 | 4,908.81 | 6,969.32 | 8,219.11 | 10,279.62 | 11,529.41 | 13,589.92 |
| Fibonacci | 4,773.69 | 6,038.23 | 6,819.46 | 8,083.99 | 9,348.53 | 10,129.76 | 11,394.29 |
Numerical data
The following is the status of the technical indicators and moving averages at the time of publication of this technical analysis:
| RSI (14): | 49.02 | |
| MACD (12,26,9): | 195.5300 | |
| Directional Movement: | -3.27 | |
| AROON (14): | 50.00 | |
| DEMA (21): | 9,433.03 | |
| Parabolic SAR (0,02-0,02-0,2): | 9,956.59 | |
| Elder Ray (13): | -372.11 | |
| Super Trend (3,10): | 8,476.04 | |
| Zig ZAG (10): | 8,885.67 | |
| VORTEX (21): | 1.0100 | |
| Stochastique (14,3,5): | 36.72 | |
| TEMA (21): | 9,247.70 | |
| Williams %R (14): | -77.60 | |
| Chande Momentum Oscillator (20): | -445.21 | |
| Repulse (5,40,3): | -3.3800 | |
| ROCnROLL: | -1 | |
| TRIX (15,9): | 0.6200 | |
| Courbe Coppock: | 0.66 |
| MA7: | 9,187.38 | |
| MA20: | 9,307.55 | |
| MA50: | 8,271.74 | |
| MA100: | 7,927.00 | |
| MAexp7: | 9,096.43 | |
| MAexp20: | 9,086.40 | |
| MAexp50: | 8,545.92 | |
| MAexp100: | 8,249.14 | |
| Price / MA7: | -2.83% | |
| Price / MA20: | -4.08% | |
| Price / MA50: | +7.93% | |
| Price / MA100: | +12.62% | |
| Price / MAexp7: | -1.86% | |
| Price / MAexp20: | -1.75% | |
| Price / MAexp50: | +4.46% | |
| Price / MAexp100: | +8.22% |
About author

Online


Add a comment
Comments
0 comments on the analysis BITCOIN - BTC/USD - Daily