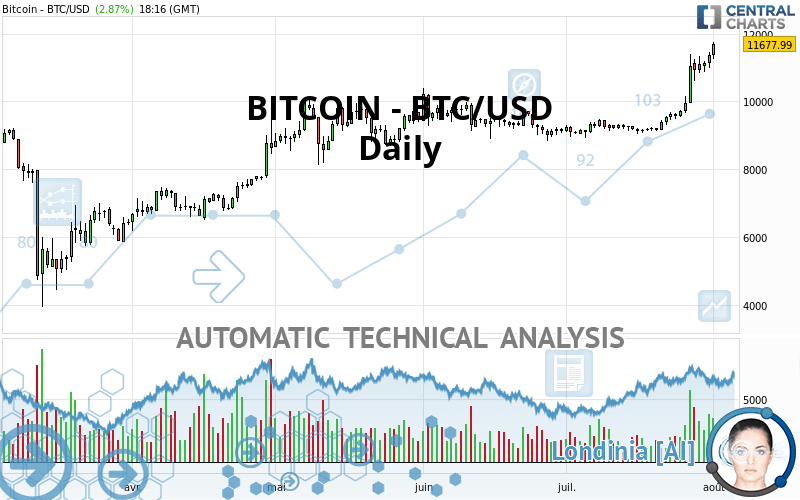
BITCOIN - BTC/USD - Daily - Technical analysis published on 08/01/2020 (GMT)
- Who voted?
- 208
- 0
Click here for a new analysis!
- Timeframe : Daily
- - Analysis generated on
- Status : LEVEL MAINTAINED

Summary of the analysis

Additional analysis
Quotes
BITCOIN - BTC/USD rating 11,677.99 USD. On the day, this instrument gained +2.88% and was between 11,239.40 USD and 11,749.78 USD. This implies that the price is at +3.90% from its lowest and at -0.61% from its highest.The Central Gaps scanner detects a bearish opening. A small advantage for sellers in the very short term.
Bearish opening
Type : Bearish
Timeframe : Openning
So that you have an overall view of the price change, here is a table showing the variations over several periods:
New HIGH record (1 year)
Type : Bullish
Timeframe : Weekly
New HIGH record (1st january)
Type : Bullish
Timeframe : Weekly
New HIGH record (1 month)
Type : Bullish
Timeframe : Weekly
Technical
Technical analysis of this Daily chart of BITCOIN - BTC/USD indicates that the overall trend is strongly bullish. 92.86% of the signals given by moving averages are bullish. The overall trend is supported by the strong bullish signals from short-term moving averages. There is no crossing of moving average by the price or crossing of moving averages between themselves.
An assessment of technical indicators shows a strong bullish signal.
Caution: the Central Indicators scanner currently detects an excess:
RSI indicator is overbought : over 80
Type : Neutral
Timeframe : Daily
CCI indicator is overbought : over 100
Type : Neutral
Timeframe : Daily
Williams %R indicator is overbought : over -20
Type : Neutral
Timeframe : Daily
Pivot points : price is over resistance 2
Type : Neutral
Timeframe : Daily
Pivot points : price is over resistance 3
Type : Neutral
Timeframe : Weekly
The Central Patterns scanner, which studies chart patterns, resistances and supports, has identified these signals:
Horizontal resistance is broken
Type : Bullish
Timeframe : Daily
Resistance of channel is broken
Type : Bullish
Timeframe : Daily
The Central Candlesticks scanner which studies Japanese candlesticks did not detect anything.
| S3 | S2 | S1 | Price | R1 | R2 | |
|---|---|---|---|---|---|---|
| ProTrendLines | 7,367.90 | 9,149.89 | 10,371.20 | 11,677.99 | 12,932.90 | 19,345.50 |
| Change (%) | -36.91% | -21.65% | -11.19% | - | +10.75% | +65.66% |
| Change | -4,310.09 | -2,528.10 | -1,306.79 | - | +1,254.91 | +7,667.51 |
| Level | Minor | Major | Major | - | Intermediate | Major |
Attention could also be paid to pivot points to set price objectives:
| Pivot points | S3 | S2 | S1 | PP | R1 | R2 | R3 |
|---|---|---|---|---|---|---|---|
| Standard | 10,581.48 | 10,778.55 | 11,065.11 | 11,262.18 | 11,548.74 | 11,745.81 | 12,032.37 |
| Camarilla | 11,218.68 | 11,263.01 | 11,307.35 | 11,351.68 | 11,396.01 | 11,440.35 | 11,484.68 |
| Woodie | 10,626.24 | 10,800.92 | 11,109.87 | 11,284.55 | 11,593.50 | 11,768.18 | 12,077.12 |
| Fibonacci | 10,778.55 | 10,963.29 | 11,077.43 | 11,262.18 | 11,446.92 | 11,561.06 | 11,745.81 |
| Pivot points | S3 | S2 | S1 | PP | R1 | R2 | R3 |
|---|---|---|---|---|---|---|---|
| Standard | 8,663.19 | 8,886.64 | 9,299.15 | 9,522.60 | 9,935.11 | 10,158.56 | 10,571.07 |
| Camarilla | 9,536.77 | 9,595.07 | 9,653.36 | 9,711.66 | 9,769.96 | 9,828.25 | 9,886.55 |
| Woodie | 8,757.72 | 8,933.91 | 9,393.68 | 9,569.87 | 10,029.64 | 10,205.83 | 10,665.60 |
| Fibonacci | 8,886.64 | 9,129.58 | 9,279.66 | 9,522.60 | 9,765.54 | 9,915.62 | 10,158.56 |
| Pivot points | S3 | S2 | S1 | PP | R1 | R2 | R3 |
|---|---|---|---|---|---|---|---|
| Standard | 7,171.45 | 8,050.52 | 9,701.10 | 10,580.17 | 12,230.75 | 13,109.82 | 14,760.40 |
| Camarilla | 10,656.03 | 10,887.91 | 11,119.80 | 11,351.68 | 11,583.56 | 11,815.45 | 12,047.33 |
| Woodie | 7,557.20 | 8,243.40 | 10,086.86 | 10,773.05 | 12,616.51 | 13,302.70 | 15,146.16 |
| Fibonacci | 8,050.52 | 9,016.85 | 9,613.84 | 10,580.17 | 11,546.50 | 12,143.49 | 13,109.82 |
Numerical data
The following are the details of the technical indicators and moving averages that were collected to generate this technical analysis:
| RSI (14): | 85.05 | |
| MACD (12,26,9): | 554.3500 | |
| Directional Movement: | 38.12 | |
| AROON (14): | 92.86 | |
| DEMA (21): | 10,863.13 | |
| Parabolic SAR (0,02-0,02-0,2): | 10,245.76 | |
| Elder Ray (13): | 925.22 | |
| Super Trend (3,10): | 10,284.73 | |
| Zig ZAG (10): | 11,748.53 | |
| VORTEX (21): | 1.3000 | |
| Stochastique (14,3,5): | 94.27 | |
| TEMA (21): | 11,307.09 | |
| Williams %R (14): | -0.68 | |
| Chande Momentum Oscillator (20): | 2,568.09 | |
| Repulse (5,40,3): | 9.3900 | |
| ROCnROLL: | 1 | |
| TRIX (15,9): | 0.4800 | |
| Courbe Coppock: | 38.73 |
| MA7: | 11,029.96 | |
| MA20: | 9,928.31 | |
| MA50: | 9,544.70 | |
| MA100: | 9,363.46 | |
| MAexp7: | 11,019.58 | |
| MAexp20: | 10,246.89 | |
| MAexp50: | 9,711.06 | |
| MAexp100: | 9,285.39 | |
| Price / MA7: | +5.88% | |
| Price / MA20: | +17.62% | |
| Price / MA50: | +22.35% | |
| Price / MA100: | +24.72% | |
| Price / MAexp7: | +5.97% | |
| Price / MAexp20: | +13.97% | |
| Price / MAexp50: | +20.25% | |
| Price / MAexp100: | +25.77% |
About author

Online


Add a comment
Comments
0 comments on the analysis BITCOIN - BTC/USD - Daily