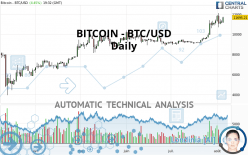
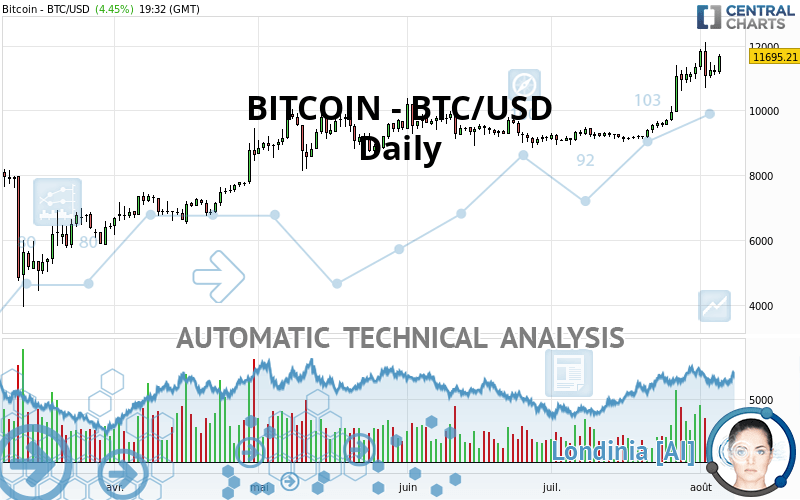
BITCOIN - BTC/USD - Daily - Technical analysis published on 08/05/2020 (GMT)
- Who voted?
- 177
- 0
Click here for a new analysis!
- Timeframe : Daily
- - Analysis generated on
- Status : LEVEL MAINTAINED
Summary of the analysis

Additional analysis
Quotes
The BITCOIN - BTC/USD price is 11,695.21 USD. The price has increased by +4.45% since the last closing and was between 11,118.04 USD and 11,732.12 USD. This implies that the price is at +5.19% from its lowest and at -0.31% from its highest.A bullish gap was detected at the opening by the Central Gaps scanner. There are a lot of buyers and they have the upper hand in the very short term.
Opening Gap UP
Type : Bullish
Timeframe : Openning
So that you have an overall view of the price change, here is a table showing the variations over several periods:
Near a new HIGH record (1st january)
Type : Bullish
Timeframe : Weekly
Technical
Technical analysis of BITCOIN - BTC/USD in Daily shows a strongly overall bullish trend. The signals given by the moving averages are 92.86% bullish. This strong bullish trend is confirmed by the strong signals currently being given by short-term moving averages. An assessment of moving averages reveals several bearish signals that could impact this trend:
Bearish price crossover with Moving Average 20
Type : Bearish
Timeframe : Daily
Bearish price crossover with Moving Average 50
Type : Bearish
Timeframe : Daily
Bearish price crossover with Moving Average 100
Type : Bearish
Timeframe : Daily
Bearish price crossover with adaptative moving average 20
Type : Bearish
Timeframe : Daily
Bearish price crossover with adaptative moving average 50
Type : Bearish
Timeframe : Daily
Bearish price crossover with adaptative moving average 100
Type : Bearish
Timeframe : Daily
An assessment of technical indicators shows a moderate bullish signal.
Caution: the Central Indicators scanner currently detects an excess:
RSI indicator is oversold : under 30
Type : Neutral
Timeframe : Daily
CCI indicator is oversold : under -100
Type : Neutral
Timeframe : Daily
Williams %R indicator is oversold : under -80
Type : Neutral
Timeframe : Daily
Williams %R indicator is overbought : over -20
Type : Neutral
Timeframe : Daily
Pivot points : price is over resistance 3
Type : Neutral
Timeframe : Daily
Pivot points : price is over resistance 3
Type : Neutral
Timeframe : Weekly
RSI indicator is back under 50
Type : Bearish
Timeframe : Daily
MACD crosses DOWN its Moving Average
Type : Bearish
Timeframe : Daily
Parabolic SAR indicator bearish reversal
Type : Bearish
Timeframe : Daily
Ichimoku : price is under the cloud
Type : Bearish
Timeframe : Daily
SuperTrend indicator bearish reversal
Type : Bearish
Timeframe : Daily
Price is back under the pivot point
Type : Bearish
Timeframe : Weekly
Momentum indicator is back under 0
Type : Bearish
Timeframe : Daily
Williams %R indicator is back under -50
Type : Bearish
Timeframe : Daily
Central Patterns, the scanner specializing in chart patterns, did not identify any signals.
The Central Candlesticks scanner which studies Japanese candlesticks did not detect anything.
| S3 | S2 | S1 | Price | R1 | R2 | |
|---|---|---|---|---|---|---|
| ProTrendLines | 8,397.92 | 9,149.89 | 10,371.20 | 11,695.21 | 12,932.90 | 19,345.50 |
| Change (%) | -28.19% | -21.76% | -11.32% | - | +10.58% | +65.41% |
| Change | -3,297.29 | -2,545.32 | -1,324.01 | - | +1,237.69 | +7,650.29 |
| Level | Minor | Major | Major | - | Intermediate | Major |
Pivot points can also be used to set your price objectives. Here is the price situation in relation to pivot points:
| Pivot points | S3 | S2 | S1 | PP | R1 | R2 | R3 |
|---|---|---|---|---|---|---|---|
| Standard | 6,923.63 | 7,015.02 | 7,170.27 | 7,261.66 | 7,416.91 | 7,508.30 | 7,663.55 |
| Camarilla | 7,257.69 | 7,280.30 | 7,302.91 | 7,325.52 | 7,348.13 | 7,370.74 | 7,393.35 |
| Woodie | 6,955.56 | 7,030.99 | 7,202.20 | 7,277.63 | 7,448.84 | 7,524.27 | 7,695.48 |
| Fibonacci | 7,015.02 | 7,109.24 | 7,167.44 | 7,261.66 | 7,355.88 | 7,414.08 | 7,508.30 |
| Pivot points | S3 | S2 | S1 | PP | R1 | R2 | R3 |
|---|---|---|---|---|---|---|---|
| Standard | 205.38 | 215.22 | 223.16 | 233.00 | 240.94 | 250.78 | 258.72 |
| Camarilla | 226.22 | 227.85 | 229.48 | 231.11 | 232.74 | 234.37 | 236.00 |
| Woodie | 204.44 | 214.75 | 222.22 | 232.53 | 240.00 | 250.31 | 257.78 |
| Fibonacci | 215.22 | 222.01 | 226.21 | 233.00 | 239.79 | 243.99 | 250.78 |
| Pivot points | S3 | S2 | S1 | PP | R1 | R2 | R3 |
|---|---|---|---|---|---|---|---|
| Standard | 9,504.35 | 8,305.38 | 9,750.99 | 8,552.02 | 9,997.63 | 8,798.66 | 10,244.27 |
| Camarilla | 11,128.77 | 11,151.38 | 11,173.99 | 11,196.60 | 11,219.21 | 11,241.82 | 11,264.43 |
| Woodie | 10,826.64 | 8,966.53 | 11,073.28 | 9,213.17 | 11,319.92 | 9,459.81 | 11,566.56 |
| Fibonacci | 8,305.38 | 8,399.60 | 8,457.80 | 8,552.02 | 8,646.24 | 8,704.44 | 8,798.66 |
Numerical data
The following is the status of the technical indicators and moving averages at the time of publication of this technical analysis:
| RSI (14): | 57.70 | |
| MACD (12,26,9): | 318.5100 | |
| Directional Movement: | 12.72 | |
| AROON (14): | -21.43 | |
| DEMA (21): | 10,771.52 | |
| Parabolic SAR (0,02-0,02-0,2): | 12,013.55 | |
| Elder Ray (13): | 1,001.69 | |
| Super Trend (3,10): | 7,878.73 | |
| Zig ZAG (10): | 11,695.86 | |
| VORTEX (21): | 1.1100 | |
| Stochastique (14,3,5): | 54.37 | |
| TEMA (21): | 10,887.26 | |
| Williams %R (14): | -8.67 | |
| Chande Momentum Oscillator (20): | 1,973.01 | |
| Repulse (5,40,3): | 5.0500 | |
| ROCnROLL: | 1 | |
| TRIX (15,9): | 0.5900 | |
| Courbe Coppock: | 26.51 |
| MA7: | 10,813.13 | |
| MA20: | 10,260.08 | |
| MA50: | 9,652.91 | |
| MA100: | 9,506.51 | |
| MAexp7: | 10,551.70 | |
| MAexp20: | 10,334.21 | |
| MAexp50: | 9,854.00 | |
| MAexp100: | 9,399.48 | |
| Price / MA7: | +8.16% | |
| Price / MA20: | +13.99% | |
| Price / MA50: | +21.16% | |
| Price / MA100: | +23.02% | |
| Price / MAexp7: | +10.84% | |
| Price / MAexp20: | +13.17% | |
| Price / MAexp50: | +18.68% | |
| Price / MAexp100: | +24.42% |
About author

Online


Add a comment
Comments
0 comments on the analysis BITCOIN - BTC/USD - Daily