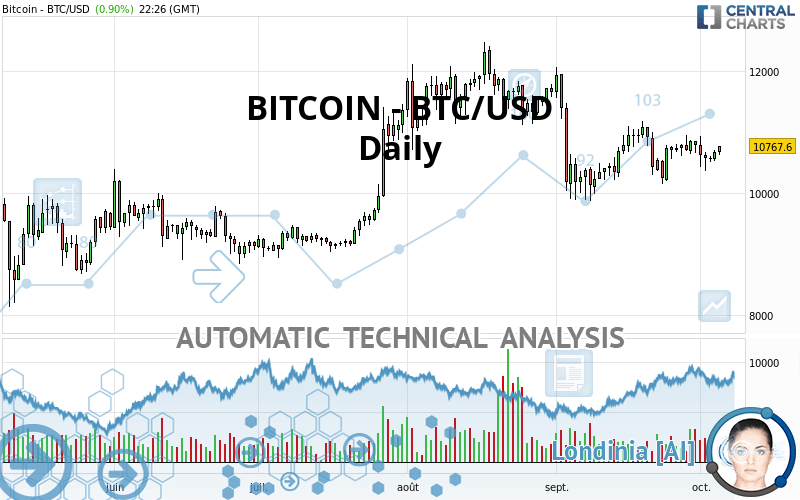
BITCOIN - BTC/USD - Daily - Technical analysis published on 10/05/2020 (GMT)
- Who voted?
- 145
- 0
Click here for a new analysis!
- Timeframe : Daily
- - Analysis generated on
- Status : TARGET REACHED
Summary of the analysis

Additional analysis
Quotes
The BITCOIN - BTC/USD rating is 10,767.60 USD. The price registered an increase of +0.90% on the session with the lowest point at 10,622.04 USD and the highest point at 10,774.47 USD. The deviation from the price is +1.37% for the low point and -0.06% for the high point.The Central Gaps scanner detects a bearish opening marking the presence of sellers ahead of buyers at the opening but not sufficiently marked to allow the price to register a quotation gap.
Bearish opening
Type : Bearish
Timeframe : Openning
So that you have an overall view of the price change, here is a table showing the variations over several periods:
Near a new HIGH record (1 month)
Type : Bullish
Timeframe : Weekly
Technical
Technical analysis of BITCOIN - BTC/USD in Daily shows an overall slightly bullish trend. 60.71% of the signals given by moving averages are bullish. The slightly bullish signals given by short-term moving averages do not show a strengthening of this global trend. The Central Indicators scanner detects bullish and bearish signals on moving averages that could impact this trend:
Bearish trend reversal : Moving Average 20
Type : Bearish
Timeframe : Daily
Bullish price crossover with Moving Average 100
Type : Bullish
Timeframe : Daily
Bullish price crossover with adaptative moving average 100
Type : Bullish
Timeframe : Daily
In fact, according to the parameters integrated into the Central Analyzer system, 12 technical indicators out of 18 analysed are currently bullish. Caution: the Central Indicators scanner currently detects an excess:
Williams %R indicator is overbought : over -20
Type : Neutral
Timeframe : Daily
Pivot points : price is over resistance 1
Type : Neutral
Timeframe : Daily
Price is back under the pivot point
Type : Bearish
Timeframe : Weekly
Williams %R indicator is back over -50
Type : Bullish
Timeframe : Daily
Central Patterns, the scanner specializing in chart patterns, did not identify any signals.
Central Candlesticks, the scanner specialised in Japanese candlesticks, detects a bullish signal that could support the hypothesis of a small rebound in the very short term:
Bullish engulfing lines
Type : Bullish
Timeframe : Daily
| S3 | S2 | S1 | Price | R1 | R2 | R3 | |
|---|---|---|---|---|---|---|---|
| ProTrendLines | 7,367.90 | 9,002.75 | 10,371.20 | 10,767.60 | 11,504.60 | 12,303.60 | 12,932.90 |
| Change (%) | -31.57% | -16.39% | -3.68% | - | +6.84% | +14.27% | +20.11% |
| Change | -3,399.70 | -1,764.85 | -396.40 | - | +737.00 | +1,536.00 | +2,165.30 |
| Level | Minor | Intermediate | Major | - | Intermediate | Minor | Intermediate |
Pivot points can also be used to set your price objectives. Here is the price situation in relation to pivot points:
| Pivot points | S3 | S2 | S1 | PP | R1 | R2 | R3 |
|---|---|---|---|---|---|---|---|
| Standard | 10,391.12 | 10,457.31 | 10,564.22 | 10,630.41 | 10,737.32 | 10,803.51 | 10,910.42 |
| Camarilla | 10,623.54 | 10,639.41 | 10,655.27 | 10,671.14 | 10,687.01 | 10,702.87 | 10,718.74 |
| Woodie | 10,411.49 | 10,467.49 | 10,584.59 | 10,640.59 | 10,757.69 | 10,813.69 | 10,930.79 |
| Fibonacci | 10,457.31 | 10,523.43 | 10,564.28 | 10,630.41 | 10,696.53 | 10,737.38 | 10,803.51 |
| Pivot points | S3 | S2 | S1 | PP | R1 | R2 | R3 |
|---|---|---|---|---|---|---|---|
| Standard | 9,703.58 | 10,033.74 | 10,292.28 | 10,622.44 | 10,880.98 | 11,211.14 | 11,469.68 |
| Camarilla | 10,388.93 | 10,442.89 | 10,496.86 | 10,550.82 | 10,604.78 | 10,658.75 | 10,712.71 |
| Woodie | 9,667.77 | 10,015.84 | 10,256.47 | 10,604.54 | 10,845.17 | 11,193.23 | 11,433.87 |
| Fibonacci | 10,033.74 | 10,258.62 | 10,397.56 | 10,622.44 | 10,847.32 | 10,986.26 | 11,211.14 |
| Pivot points | S3 | S2 | S1 | PP | R1 | R2 | R3 |
|---|---|---|---|---|---|---|---|
| Standard | 7,533.72 | 8,697.37 | 9,736.49 | 10,900.14 | 11,939.26 | 13,102.91 | 14,142.03 |
| Camarilla | 10,169.84 | 10,371.76 | 10,573.68 | 10,775.60 | 10,977.52 | 11,179.44 | 11,381.36 |
| Woodie | 7,471.45 | 8,666.24 | 9,674.22 | 10,869.01 | 11,876.98 | 13,071.78 | 14,079.75 |
| Fibonacci | 8,697.37 | 9,538.83 | 10,058.69 | 10,900.14 | 11,741.60 | 12,261.46 | 13,102.91 |
Numerical data
The following are the details of the technical indicators and moving averages that were collected to generate this technical analysis:
| RSI (14): | 50.50 | |
| MACD (12,26,9): | -42.8400 | |
| Directional Movement: | -3.25 | |
| AROON (14): | -14.29 | |
| DEMA (21): | 10,623.54 | |
| Parabolic SAR (0,02-0,02-0,2): | 10,950.99 | |
| Elder Ray (13): | 19.31 | |
| Super Trend (3,10): | 11,472.15 | |
| Zig ZAG (10): | 10,743.73 | |
| VORTEX (21): | 1.0600 | |
| Stochastique (14,3,5): | 60.50 | |
| TEMA (21): | 10,659.85 | |
| Williams %R (14): | -24.82 | |
| Chande Momentum Oscillator (20): | 514.87 | |
| Repulse (5,40,3): | 2.0300 | |
| ROCnROLL: | 1 | |
| TRIX (15,9): | -0.0900 | |
| Courbe Coppock: | 1.00 |
| MA7: | 10,684.25 | |
| MA20: | 10,721.79 | |
| MA50: | 10,950.35 | |
| MA100: | 10,586.07 | |
| MAexp7: | 10,678.19 | |
| MAexp20: | 10,696.80 | |
| MAexp50: | 10,755.92 | |
| MAexp100: | 10,504.78 | |
| Price / MA7: | +0.78% | |
| Price / MA20: | +0.43% | |
| Price / MA50: | -1.67% | |
| Price / MA100: | +1.71% | |
| Price / MAexp7: | +0.84% | |
| Price / MAexp20: | +0.66% | |
| Price / MAexp50: | +0.11% | |
| Price / MAexp100: | +2.50% |
About author

Online


Add a comment
Comments
0 comments on the analysis BITCOIN - BTC/USD - Daily