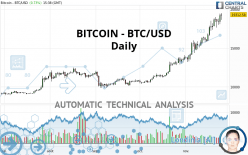
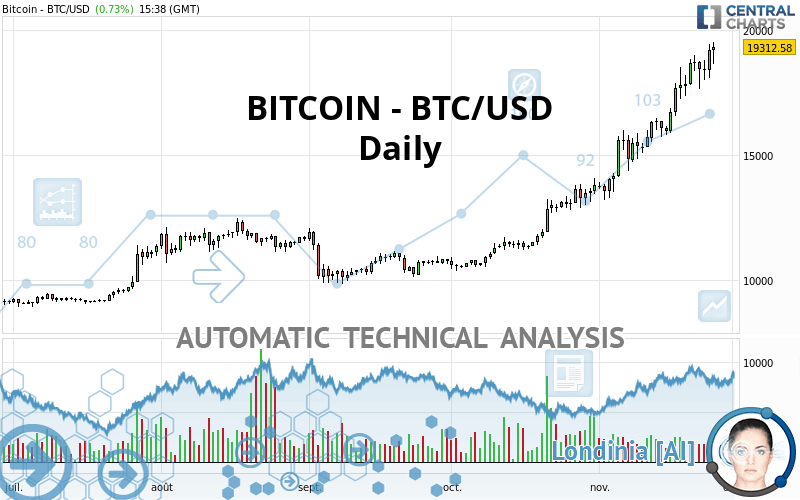
BITCOIN - BTC/USD - Daily - Technical analysis published on 11/25/2020 (GMT)
- 157
- 0
- Timeframe : Daily
- - Analysis generated on
- Status : WITHOUT TARGET
Summary of the analysis

Additional analysis
Quotes
The BITCOIN - BTC/USD price is 19,312.58 USD. The price has increased by +0.73% since the last closing with the lowest point at 18,648.40 USD and the highest point at 19,507.39 USD. The deviation from the price is +3.56% for the low point and -1.00% for the high point.The Central Gaps scanner detects a bearish opening. A small advantage for sellers in the very short term.
Bearish opening
Type : Bearish
Timeframe : Openning
Here is a more detailed summary of the historical variations registered by BITCOIN - BTC/USD:
Near a new HIGH record (5 years)
Type : Bullish
Timeframe : Weekly
New HIGH record (1 year)
Type : Bullish
Timeframe : Weekly
New HIGH record (1st january)
Type : Bullish
Timeframe : Weekly
New HIGH record (1 month)
Type : Bullish
Timeframe : Weekly
Technical
Technical analysis of BITCOIN - BTC/USD in Daily shows a strongly overall bullish trend. 92.86% of the signals given by moving averages are bullish. The overall trend is supported by the strong bullish signals from short-term moving averages. There is no crossing of moving average by the price or crossing of moving averages between themselves.
An assessment of technical indicators shows a strong bullish signal.
But beware of excesses. The Central Indicators scanner currently detects this:
RSI indicator is overbought : over 80
Type : Neutral
Timeframe : Daily
CCI indicator is overbought : over 100
Type : Neutral
Timeframe : Daily
Williams %R indicator is overbought : over -20
Type : Neutral
Timeframe : Daily
Price is back over the pivot point
Type : Bullish
Timeframe : Daily
Price is back over the pivot point
Type : Bullish
Timeframe : Weekly
Central Patterns, the market scanner focusing on chart patterns, resistances and supports found these results:
Near horizontal resistance
Type : Bearish
Timeframe : Daily
Resistance of channel is broken
Type : Bullish
Timeframe : Daily
The presence of a bullish Japanese candlestick pattern detected by Central Candlesticks that could cause a very short term rebound was also detected:
Bullish engulfing lines
Type : Bullish
Timeframe : Daily
| S3 | S2 | S1 | Price | R1 | |
|---|---|---|---|---|---|
| ProTrendLines | 12,303.60 | 12,932.90 | 15,607.60 | 19,312.58 | 19,345.50 |
| Change (%) | -36.29% | -33.03% | -19.18% | - | +0.17% |
| Change | -7,008.98 | -6,379.68 | -3,704.98 | - | +32.92 |
| Level | Minor | Major | Intermediate | - | Major |
Attention could also be paid to pivot points to set price objectives:
| Pivot points | S3 | S2 | S1 | PP | R1 | R2 | R3 |
|---|---|---|---|---|---|---|---|
| Standard | 16,966.78 | 17,516.65 | 18,344.43 | 18,894.29 | 19,722.07 | 20,271.93 | 21,099.71 |
| Camarilla | 18,793.35 | 18,919.63 | 19,045.92 | 19,172.20 | 19,298.48 | 19,424.77 | 19,551.05 |
| Woodie | 17,105.74 | 17,586.13 | 18,483.38 | 18,963.77 | 19,861.02 | 20,341.41 | 21,238.66 |
| Fibonacci | 17,516.65 | 18,042.91 | 18,368.03 | 18,894.29 | 19,420.55 | 19,745.68 | 20,271.93 |
| Pivot points | S3 | S2 | S1 | PP | R1 | R2 | R3 |
|---|---|---|---|---|---|---|---|
| Standard | 13,487.27 | 14,641.73 | 16,670.87 | 17,825.33 | 19,854.47 | 21,008.93 | 23,038.07 |
| Camarilla | 17,824.51 | 18,116.34 | 18,408.17 | 18,700.00 | 18,991.83 | 19,283.66 | 19,575.49 |
| Woodie | 13,924.60 | 14,860.40 | 17,108.20 | 18,044.00 | 20,291.80 | 21,227.60 | 23,475.40 |
| Fibonacci | 14,641.73 | 15,857.87 | 16,609.20 | 17,825.33 | 19,041.47 | 19,792.80 | 21,008.93 |
| Pivot points | S3 | S2 | S1 | PP | R1 | R2 | R3 |
|---|---|---|---|---|---|---|---|
| Standard | 7,707.77 | 9,035.83 | 11,423.77 | 12,751.83 | 15,139.77 | 16,467.83 | 18,855.77 |
| Camarilla | 12,789.80 | 13,130.43 | 13,471.07 | 13,811.70 | 14,152.33 | 14,492.97 | 14,833.60 |
| Woodie | 8,237.70 | 9,300.80 | 11,953.70 | 13,016.80 | 15,669.70 | 16,732.80 | 19,385.70 |
| Fibonacci | 9,035.83 | 10,455.35 | 11,332.32 | 12,751.83 | 14,171.35 | 15,048.32 | 16,467.83 |
Numerical data
The following is the status of technical indicators and moving averages registered at the time this technical analysis was created:
| RSI (14): | 82.32 | |
| MACD (12,26,9): | 1,387.6400 | |
| Directional Movement: | 23.04 | |
| AROON (14): | 100.00 | |
| DEMA (21): | 18,936.12 | |
| Parabolic SAR (0,02-0,02-0,2): | 17,982.46 | |
| Elder Ray (13): | 1,207.30 | |
| Super Trend (3,10): | 16,382.25 | |
| Zig ZAG (10): | 19,270.89 | |
| VORTEX (21): | 1.2600 | |
| Stochastique (14,3,5): | 90.96 | |
| TEMA (21): | 19,358.12 | |
| Williams %R (14): | -5.51 | |
| Chande Momentum Oscillator (20): | 2,941.22 | |
| Repulse (5,40,3): | 7.0100 | |
| ROCnROLL: | 1 | |
| TRIX (15,9): | 1.2600 | |
| Courbe Coppock: | 39.70 |
| MA7: | 18,638.11 | |
| MA20: | 16,985.12 | |
| MA50: | 14,314.02 | |
| MA100: | 12,615.77 | |
| MAexp7: | 18,561.98 | |
| MAexp20: | 17,142.80 | |
| MAexp50: | 15,042.20 | |
| MAexp100: | 13,347.23 | |
| Price / MA7: | +3.62% | |
| Price / MA20: | +13.70% | |
| Price / MA50: | +34.92% | |
| Price / MA100: | +53.08% | |
| Price / MAexp7: | +4.04% | |
| Price / MAexp20: | +12.66% | |
| Price / MAexp50: | +28.39% | |
| Price / MAexp100: | +44.69% |
About author

Online


Add a comment
Comments
0 comments on the analysis BITCOIN - BTC/USD - Daily