BITCOIN - BTC/USD - Daily - Technical analysis published on 11/26/2020 (GMT)
- 143
- 0
Click here for a new analysis!
- Timeframe : Daily
- - Analysis generated on
- Status : TARGET REACHED
Summary of the analysis

Additional analysis
Quotes
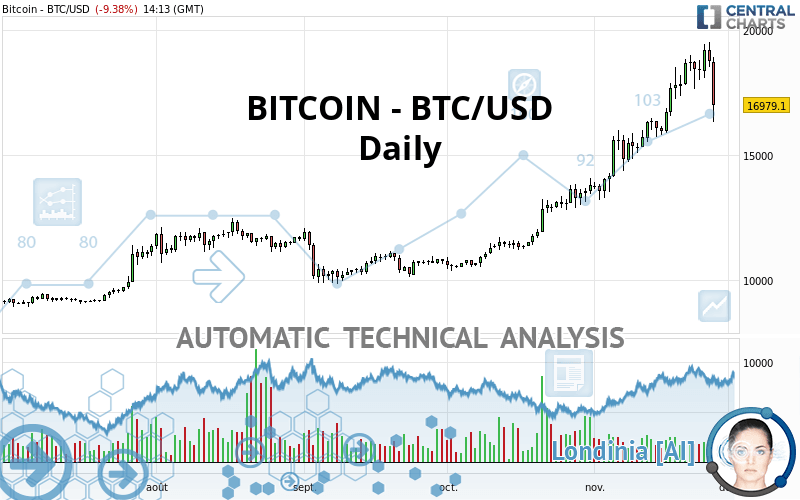
The BITCOIN - BTC/USD price is 16,981.10 USD. The price is lower by -9.37% since the last closing and was traded between 16,328.21 USD and 18,913.22 USD over the period. The price is currently at +4.00% from its lowest and -10.22% from its highest.The Central Gaps scanner detects a bearish opening marking the presence of sellers ahead of buyers at the opening but not sufficiently marked to allow the price to register a quotation gap.
Bearish opening
Type : Bearish
Timeframe : Openning
A study of price movements over other periods shows the following variations:
Near a new HIGH record (5 years)
Type : Bullish
Timeframe : Weekly
Near a new HIGH record (1 month)
Type : Bullish
Timeframe : Weekly
Technical
Technical analysis of this Daily chart of BITCOIN - BTC/USD indicates that the overall trend is bullish. 78.57% of the signals given by moving averages are bullish. Caution: the neutral signals currently given by short-term moving averages show us that the global trend is losing momentum. The Central Indicators market scanner currently does not detect any result that concerns moving averages.
On the 18 technical indicators analysed, 8 are bullish, 6 are neutral and 4 are bearish. Caution: the Central Indicators scanner currently detects an excess:
RSI indicator is overbought : over 70
Type : Neutral
Timeframe : Daily
CCI indicator is overbought : over 100
Type : Neutral
Timeframe : Daily
MACD indicator: bearish divergence
Type : Bearish
Timeframe : Daily
RSI indicator: bearish divergence
Type : Bearish
Timeframe : Daily
Pivot points : price is under support 3
Type : Neutral
Timeframe : Daily
Price is back over the pivot point
Type : Bullish
Timeframe : Weekly
An analysis of the price chart with the Central Patterns scanner (detector of chart patterns and resistances and supports) shows several results that can have an impact on the price change:
Near horizontal resistance
Type : Bearish
Timeframe : Daily
Resistance of channel is broken
Type : Bullish
Timeframe : Daily
For a small setback in the very short term, the Central Candlesticks scanner currently notes the presence of this bearish pattern in Japanese candlesticks:
Bearish harami
Type : Bearish
Timeframe : Daily
| S3 | S2 | S1 | Price | R1 | |
|---|---|---|---|---|---|
| ProTrendLines | 12,303.60 | 12,932.90 | 15,607.60 | 16,981.10 | 19,345.50 |
| Change (%) | -27.55% | -23.84% | -8.09% | - | +13.92% |
| Change | -4,677.50 | -4,048.20 | -1,373.50 | - | +2,364.40 |
| Level | Minor | Major | Intermediate | - | Major |
Attention could also be paid to pivot points to set price objectives:
| Pivot points | S3 | S2 | S1 | PP | R1 | R2 | R3 |
|---|---|---|---|---|---|---|---|
| Standard | 17,323.66 | 17,914.77 | 18,325.18 | 18,916.29 | 19,326.70 | 19,917.81 | 20,328.23 |
| Camarilla | 18,460.18 | 18,551.99 | 18,643.79 | 18,735.60 | 18,827.41 | 18,919.21 | 19,011.02 |
| Woodie | 17,233.32 | 17,869.59 | 18,234.84 | 18,871.11 | 19,236.36 | 19,872.64 | 20,237.88 |
| Fibonacci | 17,914.77 | 18,297.35 | 18,533.71 | 18,916.29 | 19,298.87 | 19,535.23 | 19,917.81 |
| Pivot points | S3 | S2 | S1 | PP | R1 | R2 | R3 |
|---|---|---|---|---|---|---|---|
| Standard | 13,487.27 | 14,641.73 | 16,670.87 | 17,825.33 | 19,854.47 | 21,008.93 | 23,038.07 |
| Camarilla | 17,824.51 | 18,116.34 | 18,408.17 | 18,700.00 | 18,991.83 | 19,283.66 | 19,575.49 |
| Woodie | 13,924.60 | 14,860.40 | 17,108.20 | 18,044.00 | 20,291.80 | 21,227.60 | 23,475.40 |
| Fibonacci | 14,641.73 | 15,857.87 | 16,609.20 | 17,825.33 | 19,041.47 | 19,792.80 | 21,008.93 |
| Pivot points | S3 | S2 | S1 | PP | R1 | R2 | R3 |
|---|---|---|---|---|---|---|---|
| Standard | 7,707.77 | 9,035.83 | 11,423.77 | 12,751.83 | 15,139.77 | 16,467.83 | 18,855.77 |
| Camarilla | 12,789.80 | 13,130.43 | 13,471.07 | 13,811.70 | 14,152.33 | 14,492.97 | 14,833.60 |
| Woodie | 8,237.70 | 9,300.80 | 11,953.70 | 13,016.80 | 15,669.70 | 16,732.80 | 19,385.70 |
| Fibonacci | 9,035.83 | 10,455.35 | 11,332.32 | 12,751.83 | 14,171.35 | 15,048.32 | 16,467.83 |
Numerical data
The following is the status of the technical indicators and moving averages at the time of publication of this technical analysis:
| RSI (14): | 56.86 | |
| MACD (12,26,9): | 1,194.1100 | |
| Directional Movement: | 2.59 | |
| AROON (14): | 92.86 | |
| DEMA (21): | 18,713.94 | |
| Parabolic SAR (0,02-0,02-0,2): | 19,507.39 | |
| Elder Ray (13): | -80.79 | |
| Super Trend (3,10): | 16,268.23 | |
| Zig ZAG (10): | 17,088.70 | |
| VORTEX (21): | 1.1100 | |
| Stochastique (14,3,5): | 69.51 | |
| TEMA (21): | 18,834.00 | |
| Williams %R (14): | -65.80 | |
| Chande Momentum Oscillator (20): | 891.60 | |
| Repulse (5,40,3): | -10.3100 | |
| ROCnROLL: | -1 | |
| TRIX (15,9): | 1.2300 | |
| Courbe Coppock: | 33.40 |
| MA7: | 18,486.67 | |
| MA20: | 17,038.76 | |
| MA50: | 14,433.86 | |
| MA100: | 12,663.10 | |
| MAexp7: | 18,146.67 | |
| MAexp20: | 17,106.43 | |
| MAexp50: | 15,109.78 | |
| MAexp100: | 13,415.99 | |
| Price / MA7: | -8.14% | |
| Price / MA20: | -0.34% | |
| Price / MA50: | +17.65% | |
| Price / MA100: | +34.10% | |
| Price / MAexp7: | -6.42% | |
| Price / MAexp20: | -0.73% | |
| Price / MAexp50: | +12.38% | |
| Price / MAexp100: | +26.57% |
About author

Online


Add a comment
Comments
0 comments on the analysis BITCOIN - BTC/USD - Daily