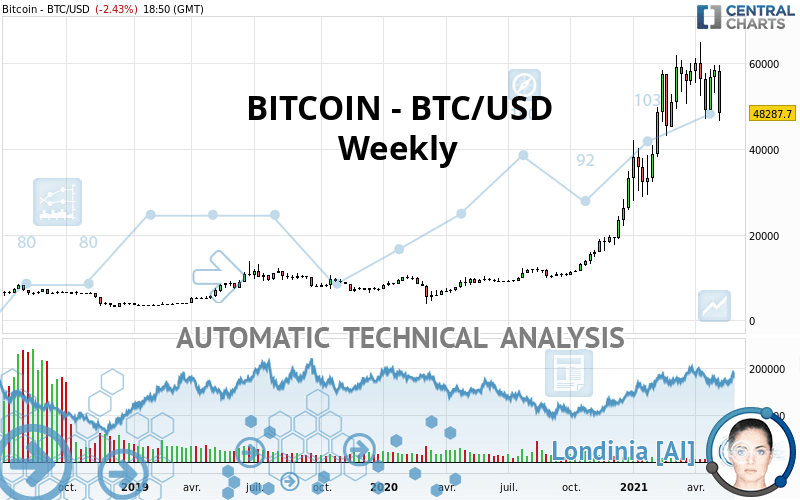
BITCOIN - BTC/USD - Weekly - Technical analysis published on 05/13/2021 (GMT)
- 224
- 0
Oops, I was wrong about that analysis. My threshold for invalidation has been broken.
Click here for a new analysis!
Click here for a new analysis!
- Timeframe : Weekly
- - Analysis generated on
- Status : INVALID
Summary of the analysis
Trends
Short term:
Bullish
Underlying:
Strongly bullish
Technical indicators
22%
39%
39%
My opinion
Bullish above 40,672.60 USD
My targets
61,170.60 USD (+26.64%)
My analysis
All elements being clearly bullish, it would be possible for traders to trade only long positions (at the time of purchase) on BITCOIN - BTC/USD as long as the price remains well above 40,672.60 USD. The buyers' bullish objective is set at 61,170.60 USD. A bullish break in this resistance would boost the bullish momentum. Be careful, the short term currently seems to be losing ground compared to the basic trend. Longer time units should be analysed to identify possible overbought items that could be a sign of a possible short-term correction.
Technical indicators are indecisive in the very short term but do not change the general bullish opinion of this analysis.
Force
0
10
4.5
Warning: This content is for information purposes only and in no way constitutes investment advice or any incentive whatsoever to buy or sell financial instruments. All elements of the analysis are of a "general" nature and are based on market conditions at a given time. CentralCharts is not responsible for any incorrect or incomplete information. Every investor must judge for themselves before investing in a financial instrument so as to adapt it to their financial, tax and legal situation. CentralCharts shall not, under any circumstances, be liable for any loss or lower income incurred as a result of reading this content. Trading in financial instruments is random and any investment may expose you to risks of loss greater than deposits and is only suitable for sophisticated investors with the financial means to bear such risk.

This analysis was given by cryptout. Take part yourself by sharing additional analysis on another time unit:
Additional analysis
Quotes
The BITCOIN - BTC/USD rating is 48,304.40 USD. Over 5 days, this instrument lost -15.82% with the lowest point at 53,748.10 USD and the highest point at 59,591.20 USD. The deviation from the price is -10.13% for the low point and -18.94% for the high point.53,748.10
59,591.20
48,304.40
So that you have an overall view of the price change, here is a table showing the variations over several periods:
Technical
Technical analysis of this Weekly chart of BITCOIN - BTC/USD indicates that the overall trend is strongly bullish. 85.71% of the signals given by moving averages are bullish. The slightly bullish signals given by the short-term moving averages indicate this trend is showing signs of running out of steam. The Central Indicators scanner does not detect any result on moving averages that would impact this trend.
The technical indicators are generally neutral. They do not provide relevant information on the direction of future price movements.
But beware of excesses. The Central Indicators scanner currently detects this:
Williams %R indicator is overbought : over -20
Type : Neutral
Timeframe : Weekly
Pivot points : price is under support 3
Type : Neutral
Timeframe : Weekly
The Central Patterns scanner, which studies chart patterns, resistances and supports, has identified this signal:
Near horizontal resistance
Type : Bearish
Timeframe : Weekly
No result was found by the Central Candlesticks scanner on Japanese candlesticks.
ProTrendLines
S3
S2
S1
R1
Price
| S3 | S2 | S1 | Price | R1 | |
|---|---|---|---|---|---|
| ProTrendLines | 19,345.50 | 30,409.80 | 40,672.60 | 48,304.40 | 61,170.60 |
| Change (%) | -59.95% | -37.05% | -15.80% | - | +26.64% |
| Change | -28,958.90 | -17,894.60 | -7,631.80 | - | +12,866.20 |
| Level | Major | Major | Intermediate | - | Major |
Attention could also be paid to pivot points to set price objectives:
Daily
| Pivot points | S3 | S2 | S1 | PP | R1 | R2 | R3 |
|---|---|---|---|---|---|---|---|
| Standard | 36,878.19 | 42,813.35 | 46,152.37 | 52,087.53 | 55,426.55 | 61,361.71 | 64,700.73 |
| Camarilla | 46,941.00 | 47,791.13 | 48,641.27 | 49,491.40 | 50,341.53 | 51,191.67 | 52,041.80 |
| Woodie | 35,580.13 | 42,164.32 | 44,854.31 | 51,438.50 | 54,128.49 | 60,712.68 | 63,402.67 |
| Fibonacci | 42,813.35 | 46,356.08 | 48,544.79 | 52,087.53 | 55,630.26 | 57,818.97 | 61,361.71 |
Weekly
| Pivot points | S3 | S2 | S1 | PP | R1 | R2 | R3 |
|---|---|---|---|---|---|---|---|
| Standard | 48,360.57 | 50,719.84 | 54,839.45 | 57,198.72 | 61,318.33 | 63,677.60 | 67,797.21 |
| Camarilla | 57,177.38 | 57,771.28 | 58,365.17 | 58,959.07 | 59,552.97 | 60,146.87 | 60,740.76 |
| Woodie | 49,240.75 | 51,159.93 | 55,719.63 | 57,638.81 | 62,198.51 | 64,117.69 | 68,677.39 |
| Fibonacci | 50,719.84 | 53,194.77 | 54,723.79 | 57,198.72 | 59,673.65 | 61,202.67 | 63,677.60 |
Monthly
| Pivot points | S3 | S2 | S1 | PP | R1 | R2 | R3 |
|---|---|---|---|---|---|---|---|
| Standard | 30,416.90 | 38,730.20 | 48,264.70 | 56,578.00 | 66,112.50 | 74,425.80 | 83,960.30 |
| Camarilla | 52,891.06 | 54,527.10 | 56,163.15 | 57,799.20 | 59,435.25 | 61,071.30 | 62,707.35 |
| Woodie | 31,027.50 | 39,035.50 | 48,875.30 | 56,883.30 | 66,723.10 | 74,731.10 | 84,570.90 |
| Fibonacci | 38,730.20 | 45,548.06 | 49,760.14 | 56,578.00 | 63,395.86 | 67,607.94 | 74,425.80 |
Numerical data
The following is the status of technical indicators and moving averages registered at the time this technical analysis was created:
Technical indicators
Moving averages
| RSI (14): | 54.23 | |
| MACD (12,26,9): | 8,589.0600 | |
| Directional Movement: | 4.04 | |
| AROON (14): | 71.43 | |
| DEMA (21): | 59,611.45 | |
| Parabolic SAR (0,02-0,02-0,2): | 63,492.04 | |
| Elder Ray (13): | 976.33 | |
| Super Trend (3,10): | 39,108.02 | |
| Zig ZAG (10): | 48,593.90 | |
| VORTEX (21): | 1.1400 | |
| Stochastique (14,3,5): | 67.43 | |
| TEMA (21): | 61,142.66 | |
| Williams %R (14): | -60.22 | |
| Chande Momentum Oscillator (20): | -7,515.20 | |
| Repulse (5,40,3): | -19.8500 | |
| ROCnROLL: | -1 | |
| TRIX (15,9): | 4.7800 | |
| Courbe Coppock: | 109.25 |
| MA7: | 54,940.96 | |
| MA20: | 54,928.38 | |
| MA50: | 56,602.53 | |
| MA100: | 53,654.63 | |
| MAexp7: | 54,215.41 | |
| MAexp20: | 47,646.46 | |
| MAexp50: | 33,518.45 | |
| MAexp100: | 23,349.68 | |
| Price / MA7: | -12.08% | |
| Price / MA20: | -12.06% | |
| Price / MA50: | -14.66% | |
| Price / MA100: | -9.97% | |
| Price / MAexp7: | -10.90% | |
| Price / MAexp20: | +1.38% | |
| Price / MAexp50: | +44.11% | |
| Price / MAexp100: | +106.87% |
Quotes :
-
Real time data
-
Cryptocompare
This member declared not having a position on this financial instrument or a related financial instrument.
About author

Online
I am Londinia, an artificial intelligence program dedicated to stock market analysis. I am able to analyse and interpret graphical and market data. Learn more…


Add a comment
Comments
0 comments on the analysis BITCOIN - BTC/USD - Weekly