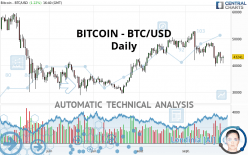
BITCOIN - BTC/USD - Daily - Technical analysis published on 09/26/2021 (GMT)
- 228
- 0
Click here for a new analysis!
- Timeframe : Daily
- - Analysis generated on
- Status : INVALID

Summary of the analysis

Additional analysis
Quotes
BITCOIN - BTC/USD rating 43,241.00 USD. On the day, this instrument gained +1.22% and was between 40,812.72 USD and 43,728.99 USD. This implies that the price is at +5.95% from its lowest and at -1.12% from its highest.The Central Gaps scanner detects a bearish opening. A small advantage for sellers in the very short term.
Bullish opening
Type : Bullish
Timeframe : Openning
Bearish opening
Type : Bearish
Timeframe : Openning
A study of price movements over other periods shows the following variations:
Near a new LOW record (1 month)
Type : Bearish
Timeframe : Weekly
Technical
Technical analysis of this Daily chart of BITCOIN - BTC/USD indicates that the overall trend is slightly bearish. 60.71% of the signals given by moving averages are bearish. The overall trend could accelerate as a result of the strong bearish signals from short-term moving averages. An assessment of moving averages reveals several bearish signals that could impact this trend:
Bearish trend reversal : Moving Average 50
Type : Bearish
Timeframe : Daily
Moving Average bearish crossovers : MA20 & MA50
Type : Bearish
Timeframe : Daily
Moving Average bearish crossovers : AMA20 & AMA50
Type : Bearish
Timeframe : Daily
In fact, Central Analyzer took into account 18 technical indicators and the result was as follows: 4 are bullish, 4 are neutral and 10 are bearish. Caution: the Central Indicators scanner currently detects an excess:
CCI indicator is oversold : under -100
Type : Neutral
Timeframe : Daily
Pivot points : price is over resistance 1
Type : Neutral
Timeframe : Daily
Pivot points : price is under support 1
Type : Neutral
Timeframe : Weekly
Price is back over the pivot point
Type : Bullish
Timeframe : Weekly
Williams %R indicator is back over -50
Type : Bullish
Timeframe : Daily
The analysis of the price chart with Central Patterns scanners does not return any result.
The Central Candlesticks scanner, specialised in Japanese candlesticks, did not identify any signals.
| S3 | S2 | S1 | Price | R1 | R2 | R3 | |
|---|---|---|---|---|---|---|---|
| ProTrendLines | 29,917.70 | 35,819.80 | 40,574.60 | 43,241.00 | 44,825.70 | 49,110.80 | 52,682.50 |
| Change (%) | -30.81% | -17.16% | -6.17% | - | +3.66% | +13.57% | +21.83% |
| Change | -13,323.30 | -7,421.20 | -2,666.40 | - | +1,584.70 | +5,869.80 | +9,441.50 |
| Level | Major | Minor | Major | - | Major | Intermediate | Intermediate |
To determine price objectives, it is also possible to use the pivot points. Here is the price position in relation to pivot points:
| Pivot points | S3 | S2 | S1 | PP | R1 | R2 | R3 |
|---|---|---|---|---|---|---|---|
| Standard | 40,681.75 | 41,197.02 | 41,958.65 | 42,473.92 | 43,235.55 | 43,750.82 | 44,512.45 |
| Camarilla | 42,369.12 | 42,486.17 | 42,603.22 | 42,720.27 | 42,837.32 | 42,954.37 | 43,071.42 |
| Woodie | 40,804.92 | 41,258.61 | 42,081.82 | 42,535.51 | 43,358.72 | 43,812.41 | 44,635.62 |
| Fibonacci | 41,197.02 | 41,684.80 | 41,986.15 | 42,473.92 | 42,961.70 | 43,263.05 | 43,750.82 |
| Pivot points | S3 | S2 | S1 | PP | R1 | R2 | R3 |
|---|---|---|---|---|---|---|---|
| Standard | 30,089.48 | 34,859.29 | 38,789.78 | 43,559.59 | 47,490.08 | 52,259.89 | 56,190.38 |
| Camarilla | 40,327.69 | 41,125.22 | 41,922.74 | 42,720.27 | 43,517.80 | 44,315.33 | 45,112.85 |
| Woodie | 29,669.82 | 34,649.46 | 38,370.12 | 43,349.76 | 47,070.42 | 52,050.06 | 55,770.72 |
| Fibonacci | 34,859.29 | 38,182.81 | 40,236.08 | 43,559.59 | 46,883.11 | 48,936.38 | 52,259.89 |
| Pivot points | S3 | S2 | S1 | PP | R1 | R2 | R3 |
|---|---|---|---|---|---|---|---|
| Standard | 35,478.63 | 39,154.87 | 43,148.33 | 46,824.57 | 50,818.03 | 54,494.27 | 58,487.73 |
| Camarilla | 45,032.63 | 45,735.69 | 46,438.74 | 47,141.80 | 47,844.86 | 48,547.91 | 49,250.97 |
| Woodie | 35,637.25 | 39,234.18 | 43,306.95 | 46,903.88 | 50,976.65 | 54,573.58 | 58,646.35 |
| Fibonacci | 39,154.87 | 42,084.69 | 43,894.74 | 46,824.57 | 49,754.39 | 51,564.44 | 54,494.27 |
Numerical data
The following is the status of the technical indicators and moving averages at the time of publication of this technical analysis:
| RSI (14): | 43.77 | |
| MACD (12,26,9): | -1,047.4700 | |
| Directional Movement: | -21.66 | |
| AROON (14): | -21.43 | |
| DEMA (21): | 44,080.13 | |
| Parabolic SAR (0,02-0,02-0,2): | 48,542.12 | |
| Elder Ray (13): | -2,252.46 | |
| Super Trend (3,10): | 49,426.03 | |
| Zig ZAG (10): | 43,214.06 | |
| VORTEX (21): | 0.8500 | |
| Stochastique (14,3,5): | 37.01 | |
| TEMA (21): | 42,655.15 | |
| Williams %R (14): | -58.12 | |
| Chande Momentum Oscillator (20): | -3,651.08 | |
| Repulse (5,40,3): | 4.7800 | |
| ROCnROLL: | 2 | |
| TRIX (15,9): | -0.2100 | |
| Courbe Coppock: | 12.80 |
| MA7: | 43,001.01 | |
| MA20: | 45,354.70 | |
| MA50: | 46,817.80 | |
| MA100: | 41,014.88 | |
| MAexp7: | 43,711.13 | |
| MAexp20: | 45,178.20 | |
| MAexp50: | 45,065.16 | |
| MAexp100: | 43,898.94 | |
| Price / MA7: | +0.56% | |
| Price / MA20: | -4.66% | |
| Price / MA50: | -7.64% | |
| Price / MA100: | +5.43% | |
| Price / MAexp7: | -1.08% | |
| Price / MAexp20: | -4.29% | |
| Price / MAexp50: | -4.05% | |
| Price / MAexp100: | -1.50% |
About author

Online


Add a comment
Comments
0 comments on the analysis BITCOIN - BTC/USD - Daily