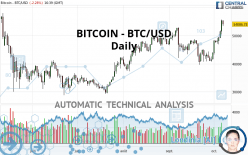
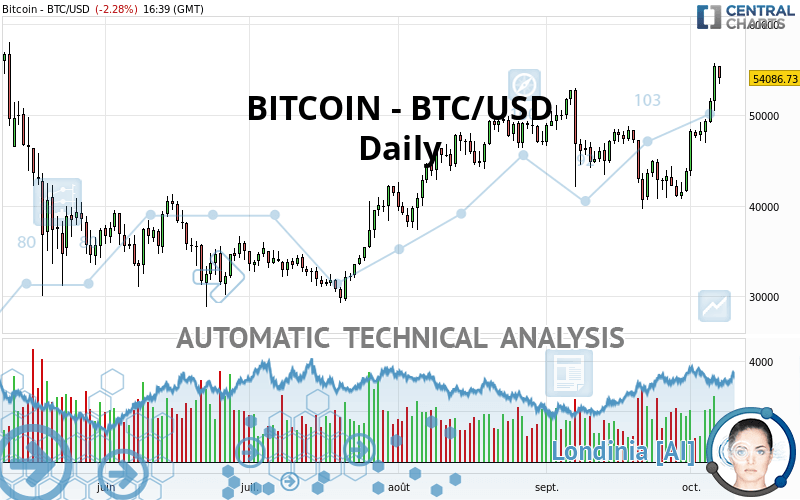
BITCOIN - BTC/USD - Daily - Technical analysis published on 10/07/2021 (GMT)
- 200
- 0
Click here for a new analysis!
- Timeframe : Daily
- - Analysis generated on
- Status : TARGET REACHED
Summary of the analysis

Additional analysis
Quotes
The BITCOIN - BTC/USD rating is 54,086.73 USD. The price is lower by -2.28% since the last closing and was between 53,404.91 USD and 55,352.57 USD. This implies that the price is at +1.28% from its lowest and at -2.29% from its highest.The Central Gaps scanner detects a bearish opening. A small advantage for sellers in the very short term.
Bearish opening
Type : Bearish
Timeframe : Openning
A study of price movements over other periods shows the following variations:
Near a new HIGH record (1 month)
Type : Bullish
Timeframe : Weekly
Technical
Technical analysis of this Daily chart of BITCOIN - BTC/USD indicates that the overall trend is strongly bullish. The signals given by the moving averages are 89.29% bullish. This strong bullish trend is confirmed by the strong signals currently being given by short-term moving averages. The Central Indicators market scanner currently does not detect any result that concerns moving averages.
In fact, 14 technical indicators on 18 studied are currently positioned bullish. Caution: the Central Indicators scanner currently detects an excess:
RSI indicator is overbought : over 70
Type : Neutral
Timeframe : Daily
CCI indicator is overbought : over 100
Type : Neutral
Timeframe : Daily
Williams %R indicator is overbought : over -20
Type : Neutral
Timeframe : Daily
Pivot points : price is over resistance 2
Type : Neutral
Timeframe : Weekly
Price is back over the pivot point
Type : Bullish
Timeframe : Daily
Central Patterns, the market scanner focusing on chart patterns, resistances and supports found these results:
Horizontal resistance is broken
Type : Bullish
Timeframe : Daily
Resistance of channel is broken
Type : Bullish
Timeframe : Daily
Resistance of triangle is broken
Type : Bullish
Timeframe : Daily
For a small rebound in the very short term, the Central Candlesticks scanner currently notes the presence of this bullish pattern in Japanese candlesticks:
Three white soldiers
Type : Bullish
Timeframe : Daily
| S3 | S2 | S1 | Price | R1 | R2 | R3 | |
|---|---|---|---|---|---|---|---|
| ProTrendLines | 40,574.60 | 48,210.80 | 52,682.50 | 54,086.73 | 55,956.20 | 58,992.90 | 63,577.00 |
| Change (%) | -24.98% | -10.86% | -2.60% | - | +3.46% | +9.07% | +17.55% |
| Change | -13,512.13 | -5,875.93 | -1,404.23 | - | +1,869.47 | +4,906.17 | +9,490.27 |
| Level | Major | Major | Intermediate | - | Intermediate | Minor | Major |
To determine price objectives, it is also possible to use the pivot points. Here is the price position in relation to pivot points:
| Pivot points | S3 | S2 | S1 | PP | R1 | R2 | R3 |
|---|---|---|---|---|---|---|---|
| Standard | 46,579.06 | 48,492.81 | 51,920.80 | 53,834.55 | 57,262.54 | 59,176.29 | 62,604.28 |
| Camarilla | 53,879.82 | 54,369.48 | 54,859.14 | 55,348.80 | 55,838.46 | 56,328.12 | 56,817.78 |
| Woodie | 47,336.19 | 48,871.37 | 52,677.93 | 54,213.11 | 58,019.67 | 59,554.85 | 63,361.41 |
| Fibonacci | 48,492.81 | 50,533.35 | 51,794.00 | 53,834.55 | 55,875.09 | 57,135.74 | 59,176.29 |
| Pivot points | S3 | S2 | S1 | PP | R1 | R2 | R3 |
|---|---|---|---|---|---|---|---|
| Standard | 35,123.46 | 37,953.63 | 42,810.56 | 45,640.73 | 50,497.66 | 53,327.83 | 58,184.76 |
| Camarilla | 45,553.54 | 46,258.19 | 46,962.84 | 47,667.49 | 48,372.14 | 49,076.79 | 49,781.44 |
| Woodie | 36,136.84 | 38,460.32 | 43,823.94 | 46,147.42 | 51,511.04 | 53,834.52 | 59,198.14 |
| Fibonacci | 37,953.63 | 40,890.10 | 42,704.26 | 45,640.73 | 48,577.20 | 50,391.36 | 53,327.83 |
| Pivot points | S3 | S2 | S1 | PP | R1 | R2 | R3 |
|---|---|---|---|---|---|---|---|
| Standard | 24,721.17 | 32,175.13 | 38,000.87 | 45,454.83 | 51,280.57 | 58,734.53 | 64,560.27 |
| Camarilla | 40,174.68 | 41,391.99 | 42,609.29 | 43,826.60 | 45,043.91 | 46,261.21 | 47,478.52 |
| Woodie | 23,907.05 | 31,768.08 | 37,186.75 | 45,047.78 | 50,466.45 | 58,327.48 | 63,746.15 |
| Fibonacci | 32,175.13 | 37,247.98 | 40,381.99 | 45,454.83 | 50,527.68 | 53,661.69 | 58,734.53 |
Numerical data
The following is the status of the technical indicators and moving averages at the time of publication of this technical analysis:
| RSI (14): | 66.02 | |
| MACD (12,26,9): | 1,685.3100 | |
| Directional Movement: | 18.75 | |
| AROON (14): | 85.72 | |
| DEMA (21): | 49,274.99 | |
| Parabolic SAR (0,02-0,02-0,2): | 43,173.67 | |
| Elder Ray (13): | 5,665.75 | |
| Super Trend (3,10): | 46,149.02 | |
| Zig ZAG (10): | 54,097.18 | |
| VORTEX (21): | 1.1100 | |
| Stochastique (14,3,5): | 93.91 | |
| TEMA (21): | 50,918.98 | |
| Williams %R (14): | -11.66 | |
| Chande Momentum Oscillator (20): | 11,250.77 | |
| Repulse (5,40,3): | 9.1100 | |
| ROCnROLL: | 1 | |
| TRIX (15,9): | 0.0500 | |
| Courbe Coppock: | 28.97 |
| MA7: | 50,572.70 | |
| MA20: | 45,961.23 | |
| MA50: | 47,214.50 | |
| MA100: | 42,517.46 | |
| MAexp7: | 50,757.71 | |
| MAexp20: | 47,687.34 | |
| MAexp50: | 46,141.93 | |
| MAexp100: | 44,647.24 | |
| Price / MA7: | +6.95% | |
| Price / MA20: | +17.68% | |
| Price / MA50: | +14.56% | |
| Price / MA100: | +27.21% | |
| Price / MAexp7: | +6.56% | |
| Price / MAexp20: | +13.42% | |
| Price / MAexp50: | +17.22% | |
| Price / MAexp100: | +21.14% |
About author

Online


Add a comment
Comments
0 comments on the analysis BITCOIN - BTC/USD - Daily