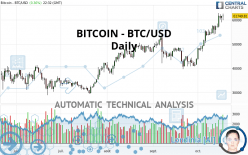
BITCOIN - BTC/USD - Daily - Technical analysis published on 10/18/2021 (GMT)
- 226
- 0
Click here for a new analysis!
- Timeframe : Daily
- - Analysis generated on
- Status : TARGET REACHED
Summary of the analysis

Additional analysis
Quotes
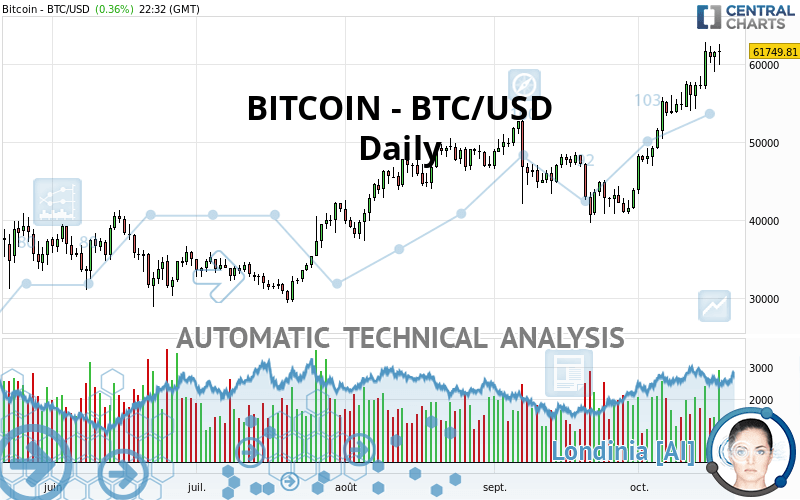
The BITCOIN - BTC/USD rating is 61,749.81 USD. On the day, this instrument gained +0.36% and was between 59,908.88 USD and 62,639.16 USD. This implies that the price is at +3.07% from its lowest and at -1.42% from its highest.The Central Gaps scanner detects a bearish opening marking the presence of sellers ahead of buyers at the opening but not sufficiently marked to allow the price to register a quotation gap.
Bearish opening
Type : Bearish
Timeframe : Openning
So that you have an overall view of the price change, here is a table showing the variations over several periods:
Near a new HIGH record (5 years)
Type : Bullish
Timeframe : Weekly
Near a new HIGH record (1 month)
Type : Bullish
Timeframe : Weekly
Technical
Technical analysis of BITCOIN - BTC/USD in Daily shows a strongly overall bullish trend. 92.86% of the signals given by moving averages are bullish. The overall trend is supported by the strong bullish signals from short-term moving averages. The Central Indicators market scanner currently does not detect any result that concerns moving averages.
Technical indicators are strongly bullish, suggesting that the price increase should continue.
Caution: the Central Indicators scanner currently detects an excess:
RSI indicator is overbought : over 70
Type : Neutral
Timeframe : Daily
CCI indicator is overbought : over 100
Type : Neutral
Timeframe : Daily
Williams %R indicator is overbought : over -20
Type : Neutral
Timeframe : Daily
Price is back over the pivot point
Type : Bullish
Timeframe : Weekly
The Central Patterns scanner, which studies chart patterns, resistances and supports, has identified these signals:
Horizontal resistance is broken
Type : Bullish
Timeframe : Daily
Resistance of channel is broken
Type : Bullish
Timeframe : Daily
From the Japanese candlestick perspective, the Central Candlesticks scanner notes the presence of these results that could impact the short-term trend:
White hanging man / hammer
Type : Neutral
Timeframe : Daily
Bullish harami
Type : Bullish
Timeframe : Daily
| S3 | S2 | S1 | Price | R1 | |
|---|---|---|---|---|---|
| ProTrendLines | 48,210.80 | 52,682.50 | 58,992.90 | 61,749.81 | 63,577.00 |
| Change (%) | -21.93% | -14.68% | -4.46% | - | +2.96% |
| Change | -13,539.01 | -9,067.31 | -2,756.91 | - | +1,827.19 |
| Level | Intermediate | Intermediate | Major | - | Major |
Pivot points can also be used to set your price objectives. Here is the price situation in relation to pivot points:
| Pivot points | S3 | S2 | S1 | PP | R1 | R2 | R3 |
|---|---|---|---|---|---|---|---|
| Standard | 57,228.13 | 58,146.84 | 59,838.72 | 60,757.43 | 62,449.31 | 63,368.02 | 65,059.90 |
| Camarilla | 60,812.70 | 61,052.00 | 61,291.31 | 61,530.61 | 61,769.91 | 62,009.22 | 62,248.52 |
| Woodie | 57,614.73 | 58,340.13 | 60,225.32 | 60,950.72 | 62,835.91 | 63,561.31 | 65,446.50 |
| Fibonacci | 58,146.84 | 59,144.08 | 59,760.18 | 60,757.43 | 61,754.67 | 62,370.77 | 63,368.02 |
| Pivot points | S3 | S2 | S1 | PP | R1 | R2 | R3 |
|---|---|---|---|---|---|---|---|
| Standard | 46,804.95 | 50,414.98 | 55,645.35 | 59,255.38 | 64,485.75 | 68,095.78 | 73,326.15 |
| Camarilla | 58,444.62 | 59,254.99 | 60,065.36 | 60,875.73 | 61,686.10 | 62,496.47 | 63,306.84 |
| Woodie | 47,615.13 | 50,820.07 | 56,455.53 | 59,660.47 | 65,295.93 | 68,500.87 | 74,136.33 |
| Fibonacci | 50,414.98 | 53,792.01 | 55,878.34 | 59,255.38 | 62,632.41 | 64,718.74 | 68,095.78 |
| Pivot points | S3 | S2 | S1 | PP | R1 | R2 | R3 |
|---|---|---|---|---|---|---|---|
| Standard | 24,721.17 | 32,175.13 | 38,000.87 | 45,454.83 | 51,280.57 | 58,734.53 | 64,560.27 |
| Camarilla | 40,174.68 | 41,391.99 | 42,609.29 | 43,826.60 | 45,043.91 | 46,261.21 | 47,478.52 |
| Woodie | 23,907.05 | 31,768.08 | 37,186.75 | 45,047.78 | 50,466.45 | 58,327.48 | 63,746.15 |
| Fibonacci | 32,175.13 | 37,247.98 | 40,381.99 | 45,454.83 | 50,527.68 | 53,661.69 | 58,734.53 |
Numerical data
The following is the status of technical indicators and moving averages registered at the time this technical analysis was created:
| RSI (14): | 72.82 | |
| MACD (12,26,9): | 3,921.0100 | |
| Directional Movement: | 21.64 | |
| AROON (14): | 78.57 | |
| DEMA (21): | 59,826.11 | |
| Parabolic SAR (0,02-0,02-0,2): | 57,998.48 | |
| Elder Ray (13): | 3,984.48 | |
| Super Trend (3,10): | 52,572.69 | |
| Zig ZAG (10): | 61,683.94 | |
| VORTEX (21): | 1.3000 | |
| Stochastique (14,3,5): | 90.07 | |
| TEMA (21): | 62,263.72 | |
| Williams %R (14): | -8.72 | |
| Chande Momentum Oscillator (20): | 6,342.54 | |
| Repulse (5,40,3): | 5.9400 | |
| ROCnROLL: | 1 | |
| TRIX (15,9): | 0.9300 | |
| Courbe Coppock: | 48.58 |
| MA7: | 59,507.01 | |
| MA20: | 53,853.04 | |
| MA50: | 49,280.11 | |
| MA100: | 45,148.04 | |
| MAexp7: | 59,684.66 | |
| MAexp20: | 55,100.82 | |
| MAexp50: | 50,466.45 | |
| MAexp100: | 47,348.66 | |
| Price / MA7: | +3.77% | |
| Price / MA20: | +14.66% | |
| Price / MA50: | +25.30% | |
| Price / MA100: | +36.77% | |
| Price / MAexp7: | +3.46% | |
| Price / MAexp20: | +12.07% | |
| Price / MAexp50: | +22.36% | |
| Price / MAexp100: | +30.42% |
About author

Online


Add a comment
Comments
0 comments on the analysis BITCOIN - BTC/USD - Daily