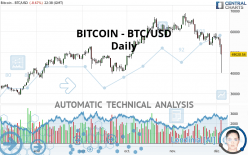
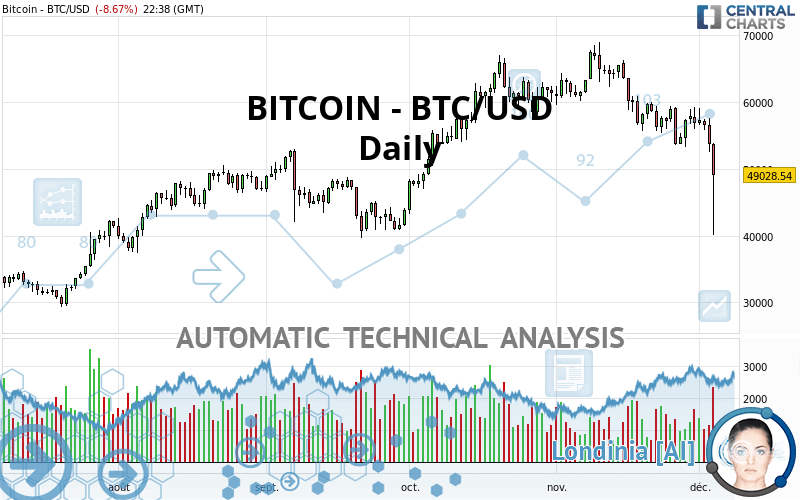
BITCOIN - BTC/USD - Daily - Technical analysis published on 12/04/2021 (GMT)
- Who voted?
- 240
- 0
Click here for a new analysis!
- Timeframe : Daily
- - Analysis generated on
- Status : LEVEL MAINTAINED
Summary of the analysis

Additional analysis
Quotes
The BITCOIN - BTC/USD price is 49,028.54 USD. The price is lower by -8.67% since the last closing with the lowest point at 40,150.10 USD and the highest point at 53,872.97 USD. The deviation from the price is +22.11% for the low point and -8.99% for the high point.A bearish opening was detected by the Central Gaps scanner. Sellers are trying to impose a bearish trend in the very short term.
Bearish opening
Type : Bearish
Timeframe : Openning
A study of price movements over other periods shows the following variations:
New LOW record (1 month)
Type : Bearish
Timeframe : Weekly
Technical
A technical analysis in Daily of this BITCOIN - BTC/USD chart shows a bearish trend. The signals given by moving averages are 67.86% bearish. This bearish trend is reinforced by the strong signals currently being given by short-term moving averages. An assessment of moving averages reveals several bearish signals that could impact this trend:
Bearish trend reversal : adaptative moving average 100
Type : Bearish
Timeframe : Daily
Bearish price crossover with Moving Average 100
Type : Bearish
Timeframe : Daily
In fact, 14 technical indicators on 18 studied are currently positioned bearish. Caution: the Central Indicators scanner currently detects an excess:
CCI indicator is oversold : under -100
Type : Neutral
Timeframe : Daily
Williams %R indicator is oversold : under -80
Type : Neutral
Timeframe : Daily
Pivot points : price is under support 3
Type : Neutral
Timeframe : Daily
Pivot points : price is under support 3
Type : Neutral
Timeframe : Weekly
Parabolic SAR indicator bearish reversal
Type : Bearish
Timeframe : Daily
The Central Patterns scanner, which studies chart patterns, resistances and supports, has identified this signal:
Support of channel is broken
Type : Bearish
Timeframe : Daily
The Central Candlesticks scanner, specialised in Japanese candlesticks, did not identify any signals.
| S3 | S2 | S1 | Price | R1 | R2 | R3 | |
|---|---|---|---|---|---|---|---|
| ProTrendLines | 29,794.70 | 35,819.80 | 40,652.10 | 49,028.54 | 52,682.50 | 58,570.80 | 63,577.00 |
| Change (%) | -39.23% | -26.94% | -17.08% | - | +7.45% | +19.46% | +29.67% |
| Change | -19,233.84 | -13,208.74 | -8,376.44 | - | +3,653.96 | +9,542.26 | +14,548.46 |
| Level | Major | Minor | Major | - | Major | Intermediate | Major |
To determine price objectives, it is also possible to use the pivot points. Here is the price position in relation to pivot points:
| Pivot points | S3 | S2 | S1 | PP | R1 | R2 | R3 |
|---|---|---|---|---|---|---|---|
| Standard | 46,392.07 | 49,436.93 | 51,561.07 | 54,605.93 | 56,730.07 | 59,774.93 | 61,899.07 |
| Camarilla | 52,263.73 | 52,737.55 | 53,211.38 | 53,685.20 | 54,159.03 | 54,632.85 | 55,106.68 |
| Woodie | 45,931.70 | 49,206.75 | 51,100.70 | 54,375.75 | 56,269.70 | 59,544.75 | 61,438.70 |
| Fibonacci | 49,436.93 | 51,411.49 | 52,631.38 | 54,605.93 | 56,580.49 | 57,800.38 | 59,774.93 |
| Pivot points | S3 | S2 | S1 | PP | R1 | R2 | R3 |
|---|---|---|---|---|---|---|---|
| Standard | 45,771.50 | 49,674.50 | 52,246.50 | 56,149.50 | 58,721.50 | 62,624.50 | 65,196.50 |
| Camarilla | 53,037.88 | 53,631.42 | 54,224.96 | 54,818.50 | 55,412.04 | 56,005.58 | 56,599.13 |
| Woodie | 45,106.00 | 49,341.75 | 51,581.00 | 55,816.75 | 58,056.00 | 62,291.75 | 64,531.00 |
| Fibonacci | 49,674.50 | 52,147.95 | 53,676.05 | 56,149.50 | 58,622.95 | 60,151.05 | 62,624.50 |
| Pivot points | S3 | S2 | S1 | PP | R1 | R2 | R3 |
|---|---|---|---|---|---|---|---|
| Standard | 34,834.63 | 44,076.67 | 50,505.53 | 59,747.57 | 66,176.43 | 75,418.47 | 81,847.33 |
| Camarilla | 52,624.90 | 54,061.40 | 55,497.90 | 56,934.40 | 58,370.90 | 59,807.40 | 61,243.90 |
| Woodie | 33,428.05 | 43,373.38 | 49,098.95 | 59,044.28 | 64,769.85 | 74,715.18 | 80,440.75 |
| Fibonacci | 44,076.67 | 50,062.95 | 53,761.28 | 59,747.57 | 65,733.85 | 69,432.18 | 75,418.47 |
Numerical data
The following are the details of the technical indicators and moving averages that were collected to generate this technical analysis:
| RSI (14): | 30.88 | |
| MACD (12,26,9): | -1,960.6200 | |
| Directional Movement: | -33.66 | |
| AROON (14): | -92.86 | |
| DEMA (21): | 54,737.59 | |
| Parabolic SAR (0,02-0,02-0,2): | 59,086.02 | |
| Elder Ray (13): | -8,815.97 | |
| Super Trend (3,10): | 59,243.68 | |
| Zig ZAG (10): | 48,782.87 | |
| VORTEX (21): | 0.6800 | |
| Stochastique (14,3,5): | 35.46 | |
| TEMA (21): | 52,768.12 | |
| Williams %R (14): | -57.04 | |
| Chande Momentum Oscillator (20): | -7,600.93 | |
| Repulse (5,40,3): | -7.3700 | |
| ROCnROLL: | 2 | |
| TRIX (15,9): | -0.3400 | |
| Courbe Coppock: | 15.55 |
| MA7: | 55,481.69 | |
| MA20: | 57,227.33 | |
| MA50: | 60,503.49 | |
| MA100: | 54,518.61 | |
| MAexp7: | 54,312.46 | |
| MAexp20: | 56,970.05 | |
| MAexp50: | 57,683.12 | |
| MAexp100: | 54,923.07 | |
| Price / MA7: | -11.63% | |
| Price / MA20: | -14.33% | |
| Price / MA50: | -18.97% | |
| Price / MA100: | -10.07% | |
| Price / MAexp7: | -9.73% | |
| Price / MAexp20: | -13.94% | |
| Price / MAexp50: | -15.00% | |
| Price / MAexp100: | -10.73% |
About author

Online


Add a comment
Comments
0 comments on the analysis BITCOIN - BTC/USD - Daily