BITCOIN - BTC/USD - BTCUSD, Daily - 05/08/2023 (GMT)
- Who voted?
- 166
- 0
- Timeframe : Daily
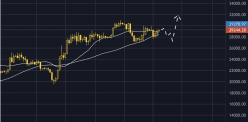

BITCOIN - BTC/USD Chart
Are you looking for opportunities in cryptocurrencies?
DISCOVER LONDINIA OPPORTUNITIES...
DISCOVER LONDINIA OPPORTUNITIES...
Bitcoin landed on the 50-day moving average, which corresponds to the dynamic support zone in the context of a rising trend, and may bounce back higher as shown in the chart. It looks stronger than the equity markets, as S&P500 and Nasdaq are consolidating, but Bitcoin is being dynamically accumulated, which could potentially turn into a bigger move with a target of $31,000. Assuming gold doesn’t absorb all the trading volume.
This member declared not having a position on this financial instrument or a related financial instrument.
About author

Offline


Add a comment
Comments
0 comments on the analysis BITCOIN - BTC/USD - Daily