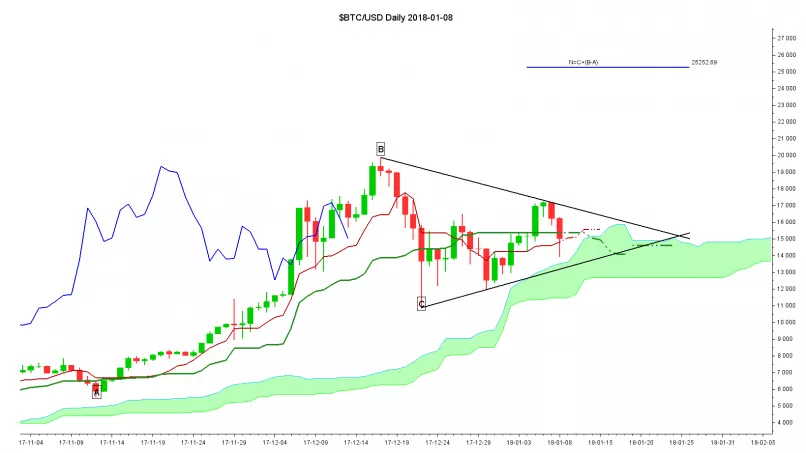
BITCOIN - BTC/USD - #Bitcoin $BTC Inside a symmetrical triangle #Blockchain #Ichimoku - 01/08/2018 (GMT)
- Who voted?
- 733
- 0
- Chart + Trading signal
- Signal : Buy signal
- |
- Entry price recommended : 13 000
- |
- Stop loss : 10 900
- |
- Take profit : 25 250
- Timeframe : Daily
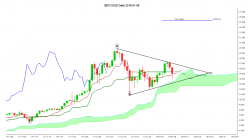
BITCOIN - BTC/USD Chart
Are you looking for opportunities in cryptocurrencies?
DISCOVER LONDINIA OPPORTUNITIES...
DISCOVER LONDINIA OPPORTUNITIES...
The price of the king of the cryptocurrencies evolve since some days into a symmetrical triangle, a classic consolidation pattern in a bullish trend. The odds are for an exit by the top.
A test of the bottom of this triangle, strengthen by the proximity of a significant level of SSB at 12680$ could be an interesting buying level.
A stop loss below the last low at 11960$
And the target could be the price target for an Ichimoku N wave at 25250$
A test of the bottom of this triangle, strengthen by the proximity of a significant level of SSB at 12680$ could be an interesting buying level.
A stop loss below the last low at 11960$
And the target could be the price target for an Ichimoku N wave at 25250$
This member declared not having a position on this financial instrument or a related financial instrument.
About author

Offline


Add a comment
Comments
0 comments on the analysis BITCOIN - BTC/USD - Daily