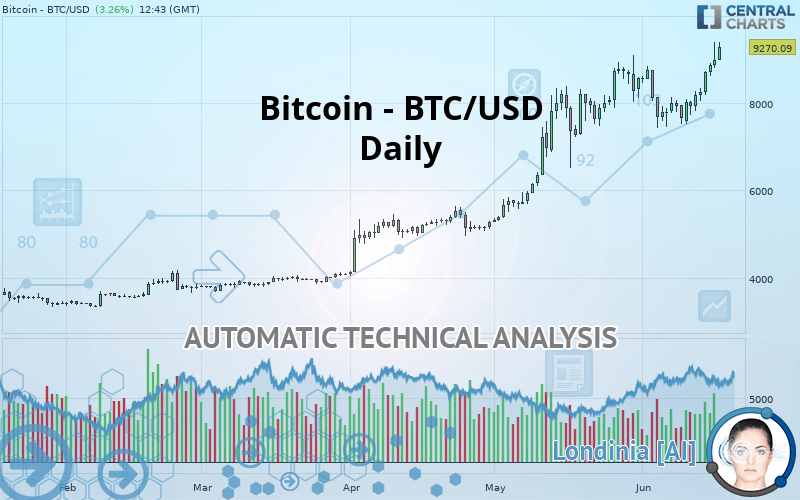
BITCOIN - BTC/USD - Daily - Technical analysis published on 06/17/2019 (GMT)
- Who voted?
- 220
- 0
Click here for a new analysis!
- Timeframe : Daily
- - Analysis generated on
- Status : TARGET REACHED
Summary of the analysis

Additional analysis
Quotes
The Bitcoin - BTC/USD price is 9,270.09 USD. The price registered an increase of +3.26% on the session with the lowest point at 8,972.71 USD and the highest point at 9,383.29 USD. The deviation from the price is +3.31% for the low point and -1.21% for the high point.The Central Gaps scanner detects a bullish opening marking the presence of sellers ahead of buyers at the opening but not sufficiently marked to allow the price to register a quotation gap.
Bearish opening
Type : Bearish
Timeframe : Openning
Here is a more detailed summary of the historical variations registered by Bitcoin - BTC/USD:
New HIGH record (1 year)
Type : Bullish
Timeframe : Weekly
New HIGH record (1st january)
Type : Bullish
Timeframe : Weekly
Near a new HIGH record (1st january)
Type : Bullish
Timeframe : Weekly
Near a new HIGH record (1 month)
Type : Bullish
Timeframe : Weekly
Technical
Technical analysis of this Daily chart of Bitcoin - BTC/USD indicates that the overall trend is strongly bullish. 92.86% of the signals given by moving averages are bullish. This strongly bullish trend is supported by the strong bullish signals given by short-term moving averages. The Central Indicators scanner detects a bearish signal on moving averages that could impact this trend:
Moving Average bearish crossovers : AMA20 & AMA50
Type : Bearish
Timeframe : Daily
In fact, 15 technical indicators on 18 studied are currently positioned bullish. Caution: the Central Indicators scanner currently detects an excess:
CCI indicator is overbought : over 100
Type : Neutral
Timeframe : Daily
Williams %R indicator is overbought : over -20
Type : Neutral
Timeframe : Daily
Ichimoku - Bullish crossover : Tenkan & Kijun
Type : Bullish
Timeframe : Daily
Price is back over the pivot point
Type : Bullish
Timeframe : Daily
Price is back over the pivot point
Type : Bullish
Timeframe : Weekly
The Central Patterns scanner, which studies chart patterns, resistances and supports, has identified this signal:
Near resistance of channel
Type : Bearish
Timeframe : Daily
No result was found by the Central Candlesticks scanner on Japanese candlesticks.
| S3 | S2 | S1 | Price | R1 | R2 | R3 | |
|---|---|---|---|---|---|---|---|
| ProTrendLines | 5,875.21 | 7,644.80 | 8,397.92 | 9,270.09 | 9,844.73 | 11,504.60 | 19,345.50 |
| Change (%) | -36.62% | -17.53% | -9.41% | - | +6.20% | +24.10% | +108.69% |
| Change | -3,394.88 | -1,625.29 | -872.17 | - | +574.64 | +2,234.51 | +10,075.41 |
| Level | Intermediate | Intermediate | Major | - | Minor | Minor | Major |
Pivot points can also be used to set your price objectives. Here is the price situation in relation to pivot points:
| Pivot points | S3 | S2 | S1 | PP | R1 | R2 | R3 |
|---|---|---|---|---|---|---|---|
| Standard | 8,138.43 | 8,470.82 | 8,724.32 | 9,056.71 | 9,310.21 | 9,642.60 | 9,896.10 |
| Camarilla | 8,816.71 | 8,870.42 | 8,924.12 | 8,977.83 | 9,031.54 | 9,085.24 | 9,138.95 |
| Woodie | 8,099.00 | 8,451.10 | 8,684.89 | 9,036.99 | 9,270.77 | 9,622.88 | 9,856.66 |
| Fibonacci | 8,470.82 | 8,694.63 | 8,832.90 | 9,056.71 | 9,280.52 | 9,418.79 | 9,642.60 |
| Pivot points | S3 | S2 | S1 | PP | R1 | R2 | R3 |
|---|---|---|---|---|---|---|---|
| Standard | 6,549.29 | 7,029.94 | 7,944.65 | 8,425.30 | 9,340.01 | 9,820.66 | 10,735.37 |
| Camarilla | 8,475.63 | 8,603.53 | 8,731.44 | 8,859.35 | 8,987.26 | 9,115.17 | 9,243.07 |
| Woodie | 6,766.31 | 7,138.46 | 8,161.67 | 8,533.81 | 9,557.03 | 9,929.17 | 10,952.39 |
| Fibonacci | 7,029.94 | 7,562.97 | 7,892.28 | 8,425.30 | 8,958.33 | 9,287.64 | 9,820.66 |
Numerical data
The following is the status of the technical indicators and moving averages at the time of publication of this technical analysis:
| RSI (14): | 69.13 | |
| MACD (12,26,9): | 337.4700 | |
| Directional Movement: | 14.41 | |
| AROON (14): | 85.72 | |
| DEMA (21): | 8,756.83 | |
| Parabolic SAR (0,02-0,02-0,2): | 7,540.94 | |
| Elder Ray (13): | 697.09 | |
| Super Trend (3,10): | 7,837.36 | |
| Zig ZAG (10): | 9,262.23 | |
| VORTEX (21): | 1.0300 | |
| Stochastique (14,3,5): | 89.90 | |
| TEMA (21): | 8,705.10 | |
| Williams %R (14): | -6.29 | |
| Chande Momentum Oscillator (20): | 1,473.07 | |
| Repulse (5,40,3): | 7.0600 | |
| ROCnROLL: | 1 | |
| TRIX (15,9): | 0.4600 | |
| Courbe Coppock: | 8.29 |
| MA7: | 8,598.14 | |
| MA20: | 8,292.68 | |
| MA50: | 7,533.56 | |
| MA100: | 6,078.87 | |
| MAexp7: | 8,724.06 | |
| MAexp20: | 8,316.75 | |
| MAexp50: | 7,554.18 | |
| MAexp100: | 6,575.56 | |
| Price / MA7: | +7.82% | |
| Price / MA20: | +11.79% | |
| Price / MA50: | +23.05% | |
| Price / MA100: | +52.50% | |
| Price / MAexp7: | +6.26% | |
| Price / MAexp20: | +11.46% | |
| Price / MAexp50: | +22.71% | |
| Price / MAexp100: | +40.98% |
About author

Online


Add a comment
Comments
0 comments on the analysis BITCOIN - BTC/USD - Daily