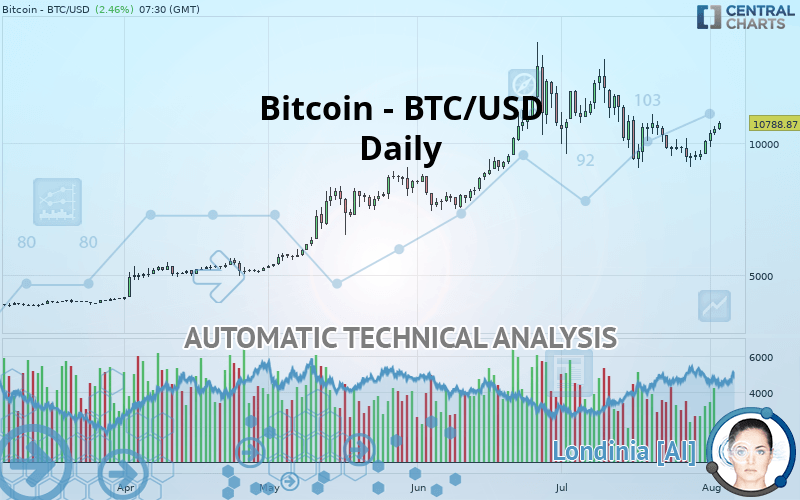
BITCOIN - BTC/USD - Daily - Technical analysis published on 08/03/2019 (GMT)
- Who voted?
- 324
- 0
Click here for a new analysis!
- Timeframe : Daily
- - Analysis generated on
- Status : TARGET REACHED

Summary of the analysis

Additional analysis
Quotes
The Bitcoin - BTC/USD price is 10,788.87 USD. On the day, this instrument gained +2.46% with the lowest point at 10,506.21 USD and the highest point at 10,860.13 USD. The deviation from the price is +2.69% for the low point and -0.66% for the high point.A bullish opening was detected by the Central Gaps scanner. Buyers are trying to impose a bullish momentum in the very short term.
Bullish opening
Type : Bullish
Timeframe : Openning
So that you have an overall view of the price change, here is a table showing the variations over several periods:
Technical
Technical analysis of Bitcoin - BTC/USD in Daily shows a strongly overall bullish trend. 85.71% of the signals given by moving averages are bullish. The slightly bullish signals given by the short-term moving averages show a weakening of the global trend. The Central Indicators market scanner is currently detecting several bullish signals that could impact this trend:
Bullish trend reversal : adaptative moving average 20
Type : Bullish
Timeframe : Daily
Bullish price crossover with Moving Average 20
Type : Bullish
Timeframe : Daily
An assessment of technical indicators shows a moderate bullish signal.
Caution: the Central Indicators scanner currently detects an excess:
Williams %R indicator is overbought : over -20
Type : Neutral
Timeframe : Daily
RSI indicator is back over 50
Type : Bullish
Timeframe : Daily
Parabolic SAR indicator bullish reversal
Type : Bullish
Timeframe : Daily
Aroon indicator bearish trend
Type : Bearish
Timeframe : Daily
Price is back over the pivot point
Type : Bullish
Timeframe : Daily
Price is back under the pivot point
Type : Bearish
Timeframe : Weekly
Williams %R indicator is back over -50
Type : Bullish
Timeframe : Daily
The Central Patterns scanner, which studies chart patterns, resistances and supports, has identified these signals:
Horizontal resistance is broken
Type : Bullish
Timeframe : Daily
Resistance of channel is broken
Type : Bullish
Timeframe : Daily
Resistance of triangle is broken
Type : Bullish
Timeframe : Daily
The Central Candlesticks scanner which studies Japanese candlesticks did not detect anything.
| S3 | S2 | S1 | Price | R1 | R2 | R3 | |
|---|---|---|---|---|---|---|---|
| ProTrendLines | 5,875.21 | 8,397.92 | 9,844.73 | 10,788.87 | 11,504.60 | 12,932.90 | 19,345.50 |
| Change (%) | -45.54% | -22.16% | -8.75% | - | +6.63% | +19.87% | +79.31% |
| Change | -4,913.66 | -2,390.95 | -944.14 | - | +715.73 | +2,144.03 | +8,556.63 |
| Level | Intermediate | Intermediate | Major | - | Intermediate | Intermediate | Major |
Pivot points can also be used to set your price objectives. Here is the price situation in relation to pivot points:
| Pivot points | S3 | S2 | S1 | PP | R1 | R2 | R3 |
|---|---|---|---|---|---|---|---|
| Standard | 9,404.67 | 9,641.99 | 10,022.58 | 10,259.90 | 10,640.49 | 10,877.81 | 11,258.40 |
| Camarilla | 10,233.24 | 10,289.88 | 10,346.52 | 10,403.16 | 10,459.80 | 10,516.44 | 10,573.09 |
| Woodie | 9,476.30 | 9,677.81 | 10,094.21 | 10,295.72 | 10,712.12 | 10,913.63 | 11,330.03 |
| Fibonacci | 9,641.99 | 9,878.04 | 10,023.86 | 10,259.90 | 10,495.95 | 10,641.77 | 10,877.81 |
| Pivot points | S3 | S2 | S1 | PP | R1 | R2 | R3 |
|---|---|---|---|---|---|---|---|
| Standard | 7,332.29 | 8,307.56 | 8,891.15 | 9,866.42 | 10,450.01 | 11,425.28 | 12,008.87 |
| Camarilla | 9,046.04 | 9,188.94 | 9,331.84 | 9,474.73 | 9,617.63 | 9,760.52 | 9,903.42 |
| Woodie | 7,136.44 | 8,209.64 | 8,695.30 | 9,768.50 | 10,254.16 | 11,327.36 | 11,813.02 |
| Fibonacci | 8,307.56 | 8,903.05 | 9,270.94 | 9,866.42 | 10,461.91 | 10,829.80 | 11,425.28 |
| Pivot points | S3 | S2 | S1 | PP | R1 | R2 | R3 |
|---|---|---|---|---|---|---|---|
| Standard | 4,250.42 | 6,661.91 | 8,373.93 | 10,785.42 | 12,497.44 | 14,908.93 | 16,620.96 |
| Camarilla | 8,952.00 | 9,329.98 | 9,707.97 | 10,085.96 | 10,463.95 | 10,841.94 | 11,219.93 |
| Woodie | 3,900.69 | 6,487.04 | 8,024.21 | 10,610.55 | 12,147.72 | 14,734.06 | 16,271.23 |
| Fibonacci | 6,661.91 | 8,237.09 | 9,210.24 | 10,785.42 | 12,360.60 | 13,333.75 | 14,908.93 |
Numerical data
The following are the details of the technical indicators and moving averages that were collected to generate this technical analysis:
| RSI (14): | 52.26 | |
| MACD (12,26,9): | -166.2300 | |
| Directional Movement: | 2.91 | |
| AROON (14): | -57.15 | |
| DEMA (21): | 9,977.08 | |
| Parabolic SAR (0,02-0,02-0,2): | 9,101.87 | |
| Elder Ray (13): | 409.82 | |
| Super Trend (3,10): | 11,643.10 | |
| Zig ZAG (10): | 10,437.62 | |
| VORTEX (21): | 0.9500 | |
| Stochastique (14,3,5): | 59.78 | |
| TEMA (21): | 9,715.19 | |
| Williams %R (14): | -33.36 | |
| Chande Momentum Oscillator (20): | -140.80 | |
| Repulse (5,40,3): | 5.4900 | |
| ROCnROLL: | 1 | |
| TRIX (15,9): | -0.3300 | |
| Courbe Coppock: | 8.90 |
| MA7: | 9,862.36 | |
| MA20: | 10,069.32 | |
| MA50: | 10,568.81 | |
| MA100: | 8,899.25 | |
| MAexp7: | 10,071.67 | |
| MAexp20: | 10,187.35 | |
| MAexp50: | 10,028.20 | |
| MAexp100: | 8,991.23 | |
| Price / MA7: | +9.39% | |
| Price / MA20: | +7.15% | |
| Price / MA50: | +2.08% | |
| Price / MA100: | +21.23% | |
| Price / MAexp7: | +7.12% | |
| Price / MAexp20: | +5.90% | |
| Price / MAexp50: | +7.59% | |
| Price / MAexp100: | +19.99% |
About author

Online


Add a comment
Comments
0 comments on the analysis BITCOIN - BTC/USD - Daily